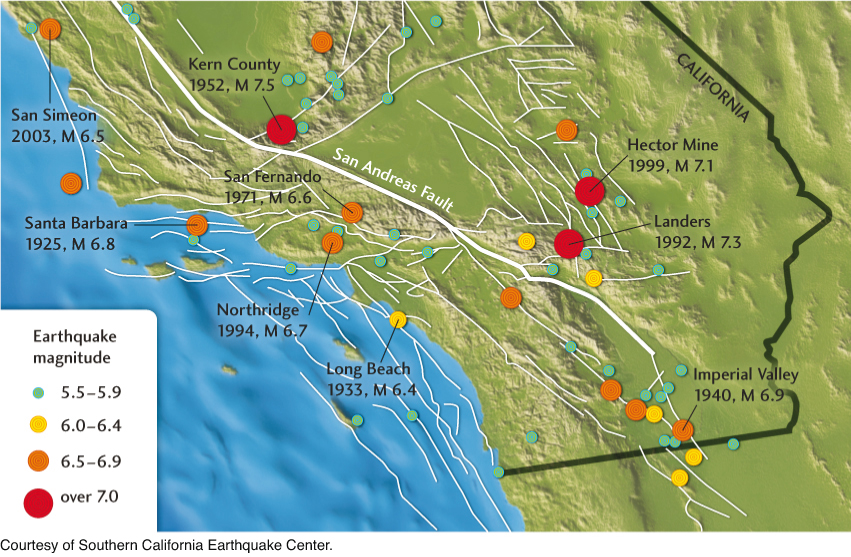
Figure 13.18A map of the fault system of Southern California, showing the surface traces of the San Andreas fault (thick white line) and its subsidiary faults (thin white lines). Colored circles show the epicenters of earthquakes with magnitudes greater than 5.5 during the twentieth century. Significant earthquakes are labeled with their names, years, and magnitudes.