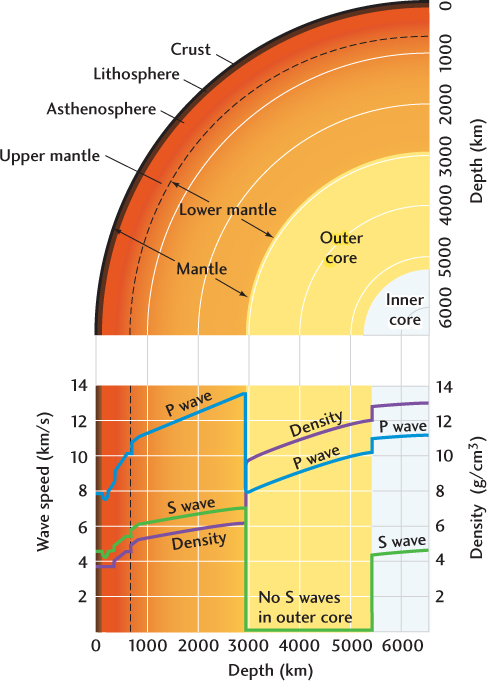
Figure 14.7Earth’s layering as revealed by seismology. The lower diagram shows changes in P-wave and S-wave velocities and rock densities with depth. The upper diagram is a cross section through Earth on the same depth scale, showing how those changes are related to the major layers (see also Figure 1.12).