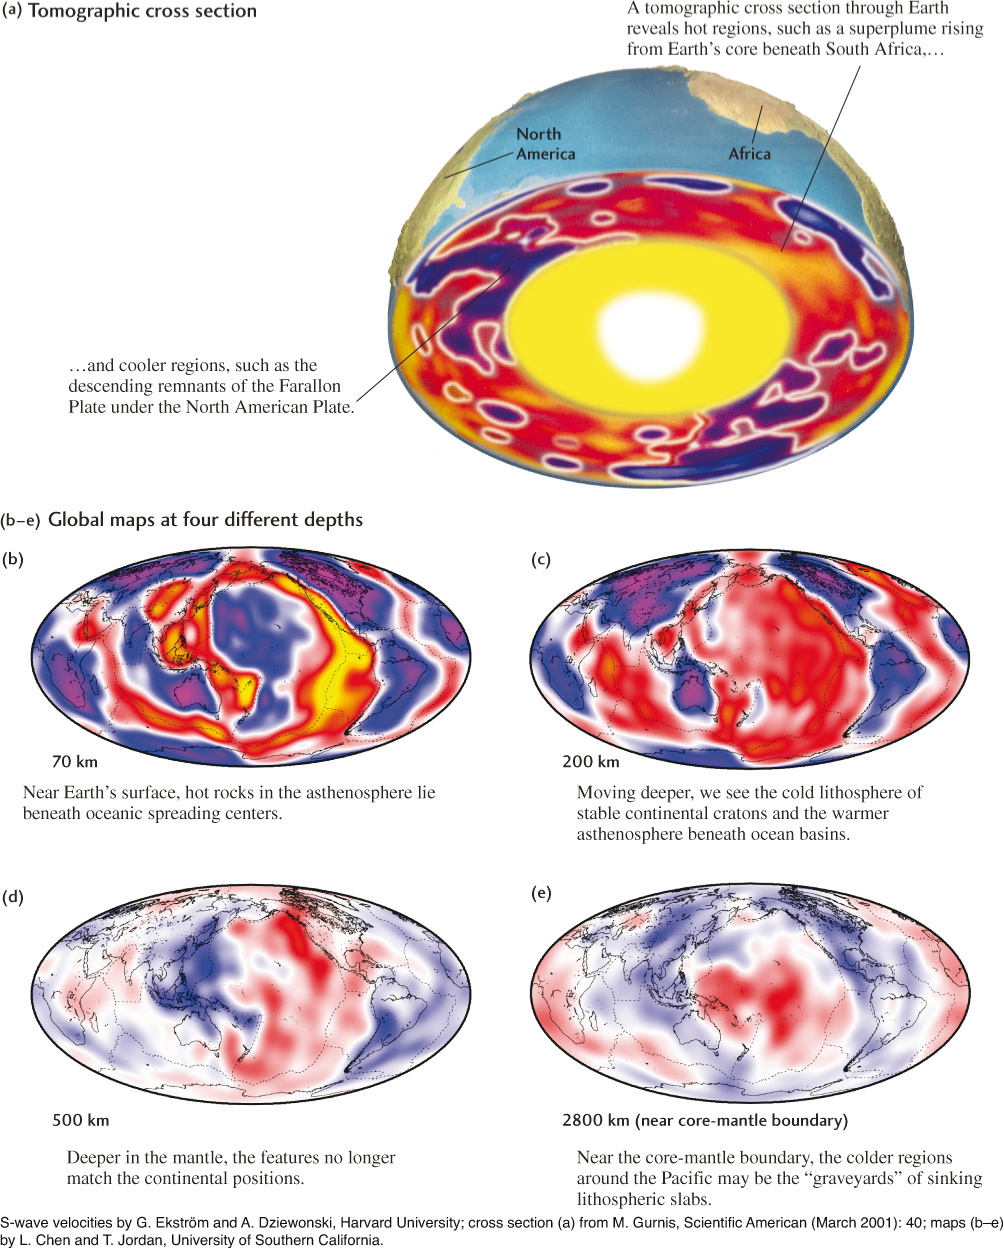
Figure 14.11A three-dimensional model of Earth’s mantle created by seismic tomography. Regions with faster S-wave velocities (blue and purple) indicate colder, denser rock; regions with slower S-wave velocities (red and yellow) indicate hotter, less dense rock. (a) Cross section of Earth. (b–e) Global maps at four different depths.