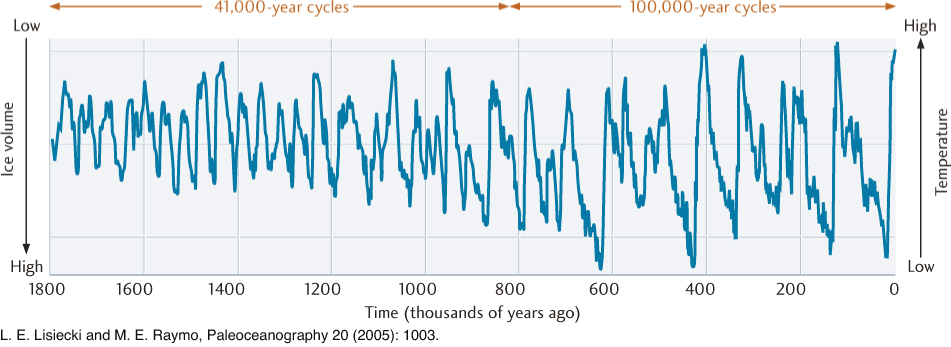
Figure 15.12Changes in global climate over the last 1.8 million years, as inferred from oxygen isotope ratios in marine sediments. The peaks indicate interglacial periods (high temperatures, low ice volumes, high sea level), and the valleys indicate ice ages (low temperatures, high ice volumes, low sea level).