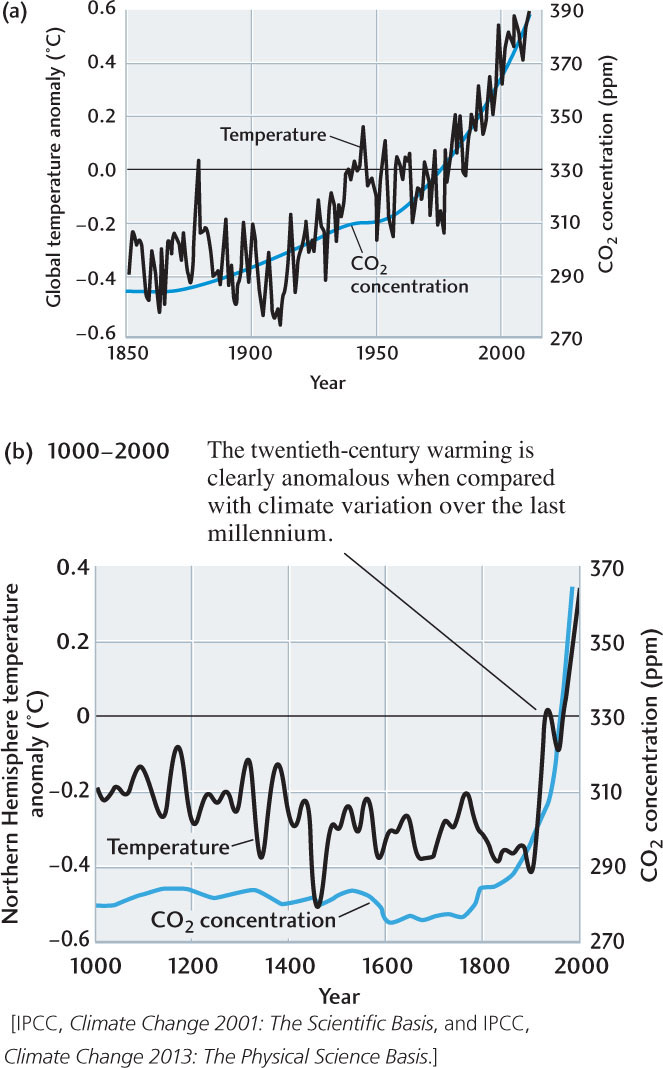
Figure 15.21A comparison of average annual surface temperature anomalies (black lines) with atmospheric CO2 concentrations (blue lines) shows a recent warming trend that is correlated with increases in atmospheric CO2 concentrations. (a) Average global annual surface temperature anomalies, calculated from thermometer measurements, and CO2 concentrations between 1850 and 2010. (b) Average annual surface temperature anomalies for the Northern Hemisphere, estimated from tree rings, ice cores, and other climate indicators, and atmospheric CO2 concentrations for the last millennium. In both of these figures, the temperature anomaly is defined as the difference between the observed temperature and the temperature average for the period 1961–1990.