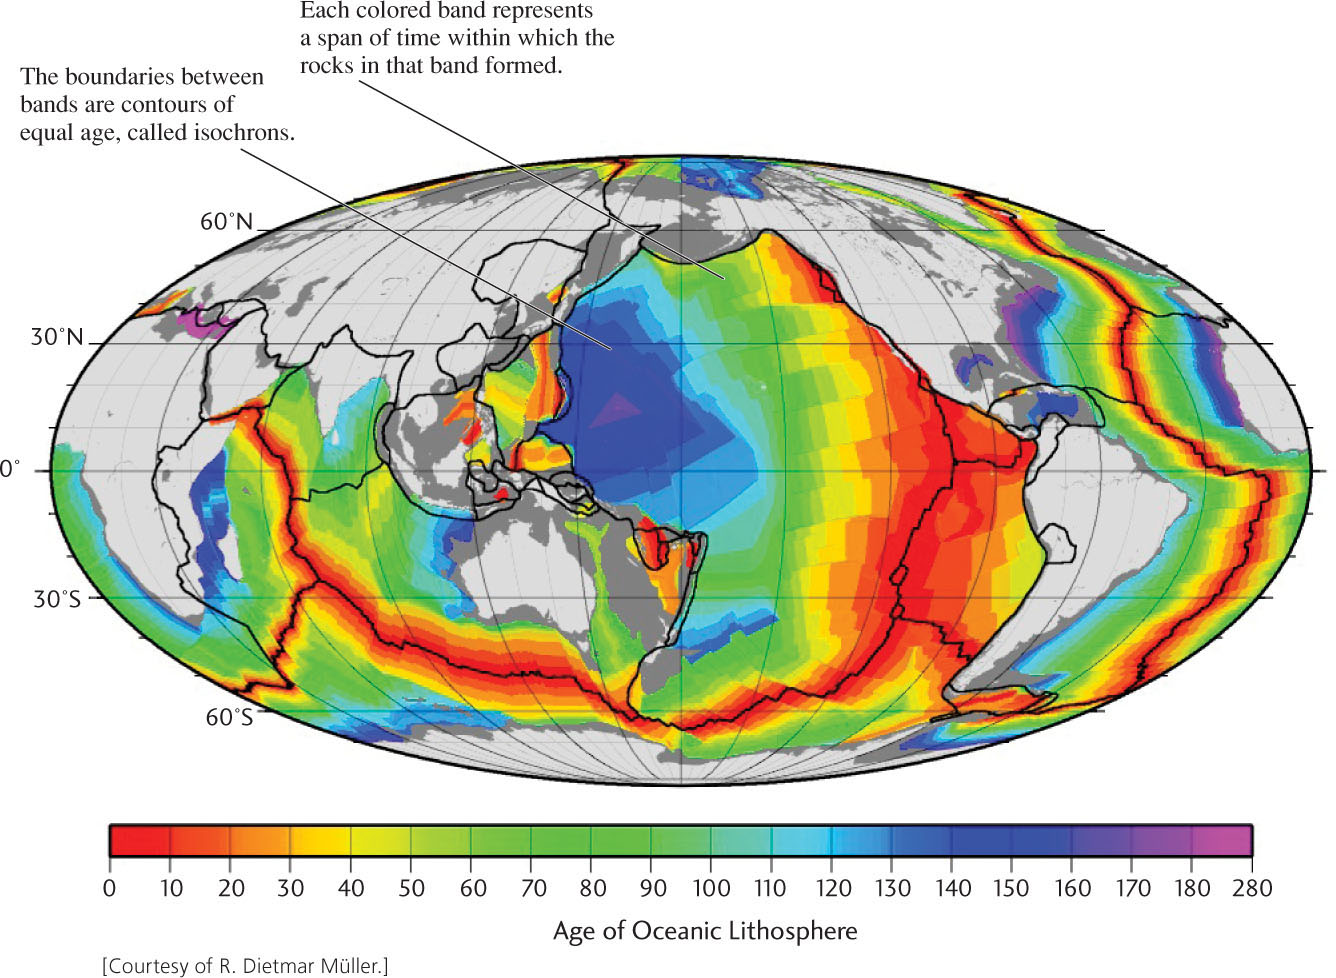
Figure 2.15This global isochron map shows the ages of rocks on the seafloor. The time scale at the bottom gives the age of the seafloor in millions of years since its creation at mid-ocean ridges. Light gray indicates land; dark gray indicates shallow water over continental shelves. Mid-ocean ridges, along which new seafloor is extruded, coincide with the youngest rocks (red).