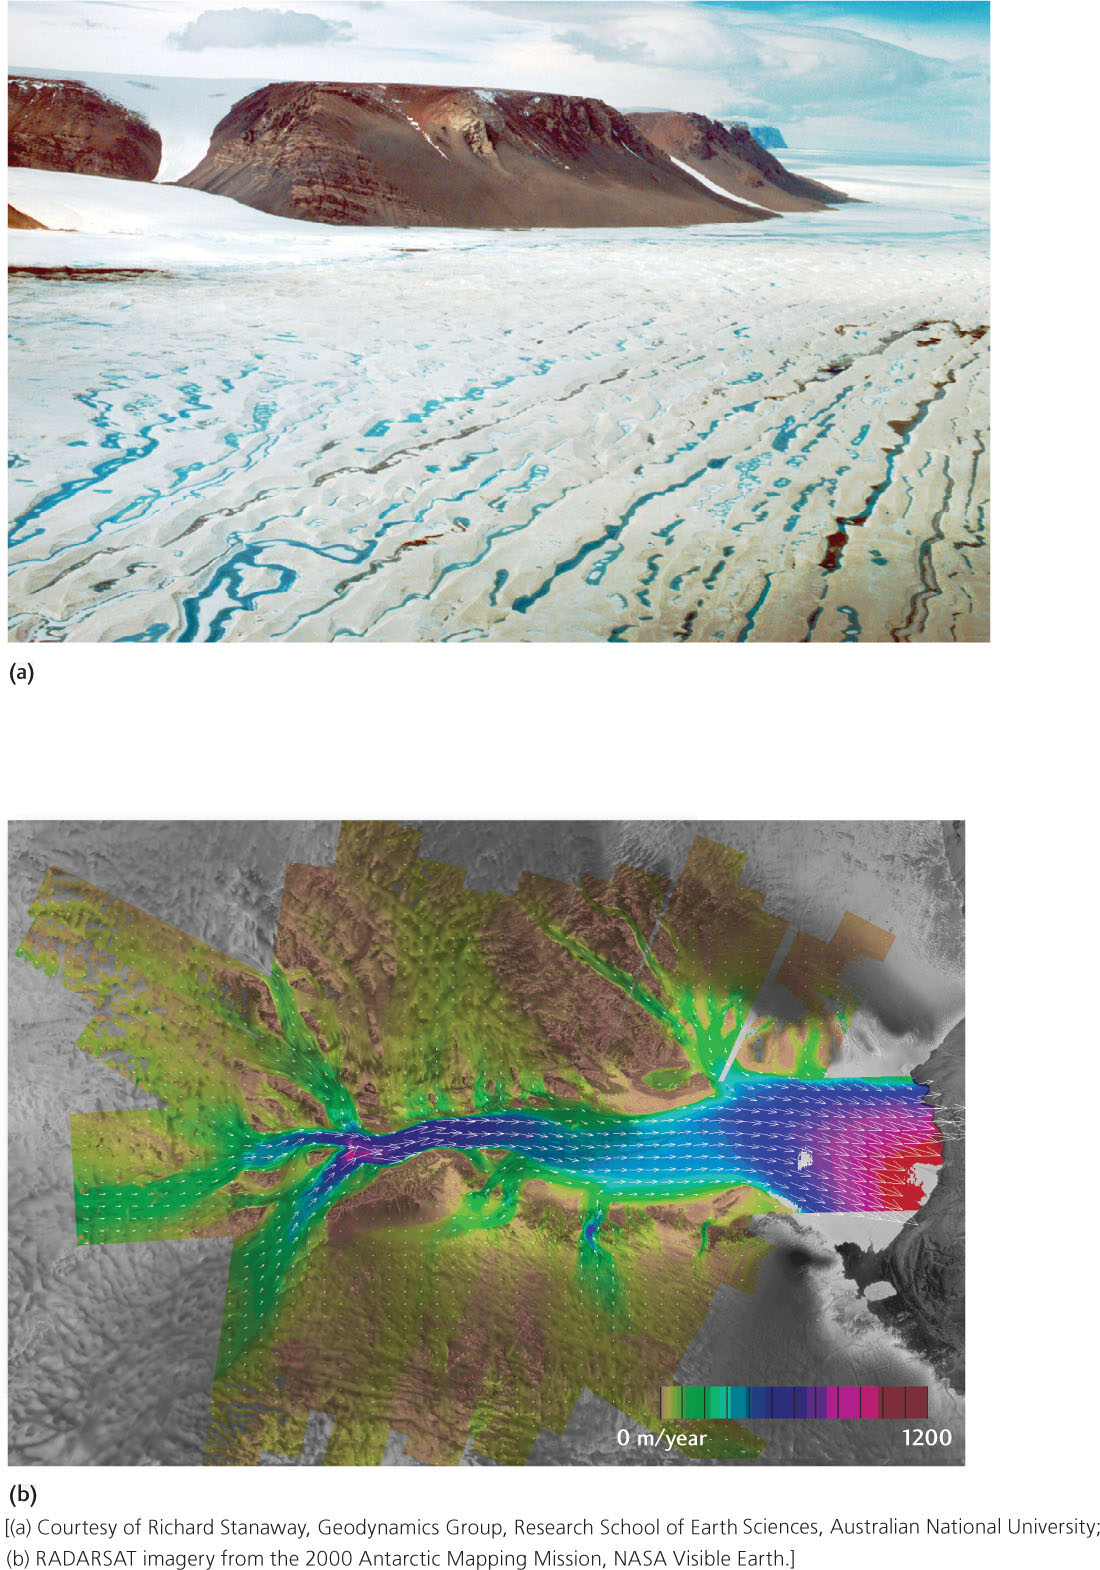
Figure 21.12(a) Lambert Glacier, Antarctica, showing lineations in the foreground where the ice is flowing more rapidly. (b) Velocity map for Lambert Glacier and its main ice stream. The arrows show the directions in which the ice is flowing. The areas of no movement (yellow) are either exposed land or stationary ice. The smaller tributary glaciers generally have low velocities of 100 to 300 m/year (green), which gradually increase as they flow down the sloping surface of the continent and intersect the upper reaches of Lambert Glacier. Most of Lambert Glacier has velocities of 400 to 800 m/year (blue). As it extends into and across the Amery Ice Shelf and the ice sheet spreads out and thins, velocities increase to 1000 to 1200 m/year (pink/red). The area of the image is about 570 km by 380 km.