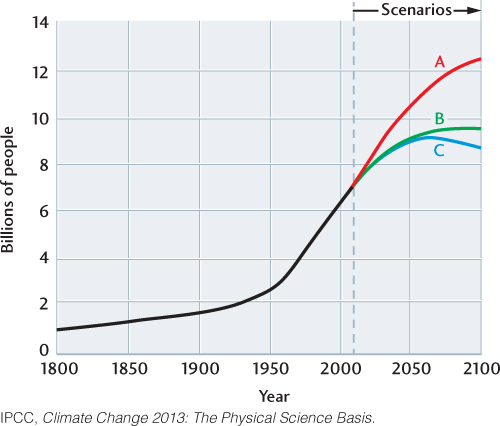
Figure 23.1The black line charts the global growth of human population since 1800. The colored lines show future population growth in three scenarios used by the IPCC to estimate human impacts on Earth’s climate. In scenario A (red line), world population continues to grow into the twenty-second century. In scenario B (green line), it levels off in the late twenty-first century, and in scenario C, it declines after 2070.