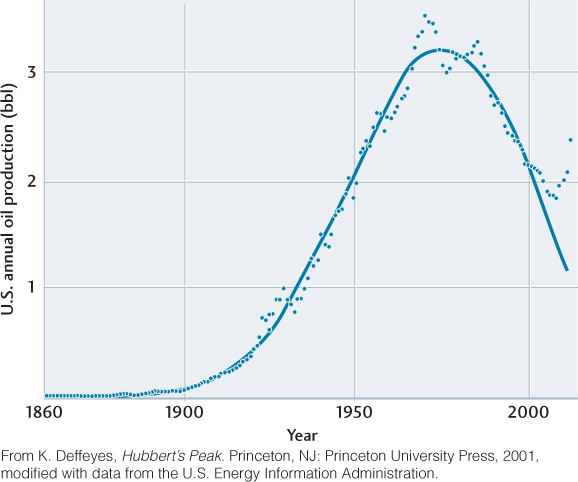
Figure 23.11U.S. annual oil production in billions of barrels (bbl) from 1860 to 2012. The points show production figures for each year. The solid line is similar to Hubbert’s 1959 projection, which predicted the peak in the 1970s and the subsequent decline. However, production reached a minimum in 2008 and has since been increasing.