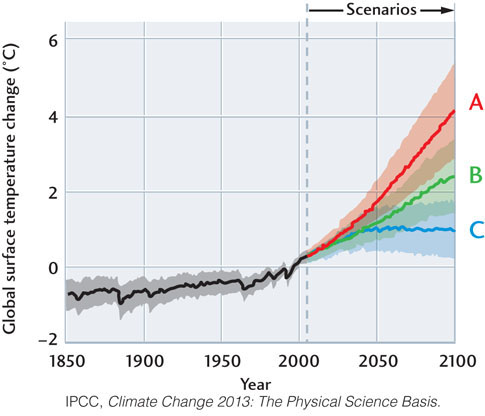
Figure 23.28IPCC projections of average surface temperatures over the twenty-first century derived from scenarios A (red line, RCP8.5), B (green line, RCP6), and C (blue line, RPC2.6). Gray-shaded band gives the uncertainties in past measurements; color-shaded band shows the prediction uncertainties due to incomplete knowledge of the climate system.