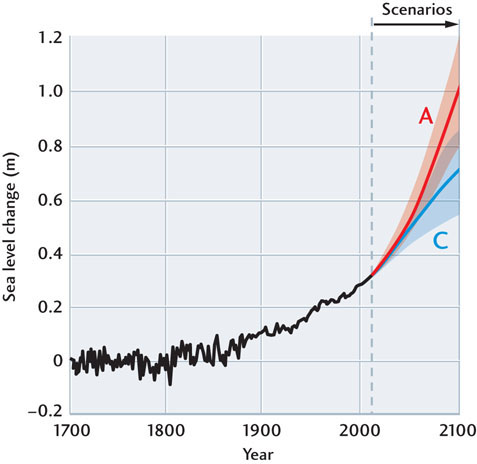
Figure 23.32Sea-level rise 1700–2100. The black line shows the observed value through 2010. The red curve is the IPCC prediction of future sea-level rise during the remainder of the twenty-first century according to scenario A; the blue curve is the prediction according to scenario C.