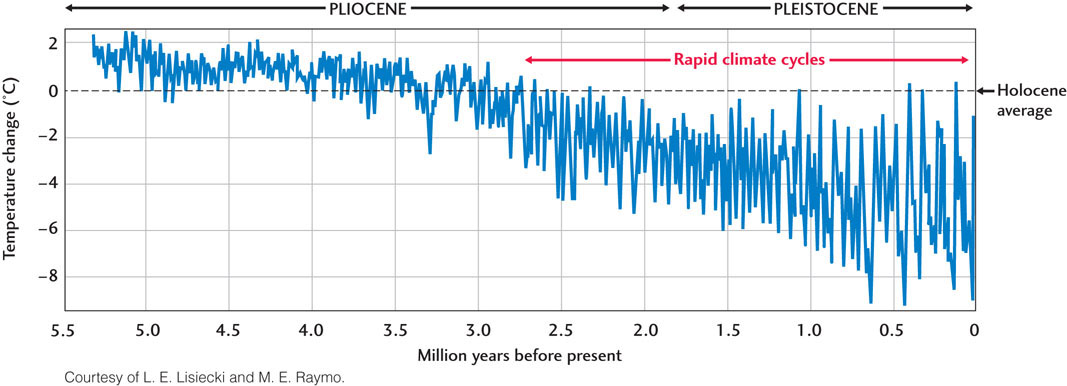
Figure 8.18Changes in Earth’s average surface temperature (jagged blue line) during the Pliocene and Pleistocene epochs, measured from temperature indicators in well-dated oceanic sediments. Zero change (dashed black line) corresponds to the average temperature during the Holocene epoch of the last 11,000 years. Note the rapid climate cycles since about 2.7 million years ago. The low temperatures during these cycles correspond to “ice ages.”