Twentieth-Century Warming: Fingerprints of Anthropogenic Global Change
How do we know that Earth’s climate is changing, or that the changes are the result of our own activities? Humans have been tracking global temperatures for some time. The most basic device for measuring climate, the thermometer, was invented in the early seventeenth century, and Daniel Fahrenheit set up the first standard temperature scale in 1724. By 1880, temperatures around the world were being reported by enough meteorological stations on land and on ships at sea to allow accurate estimation of Earth’s average annual surface temperature.
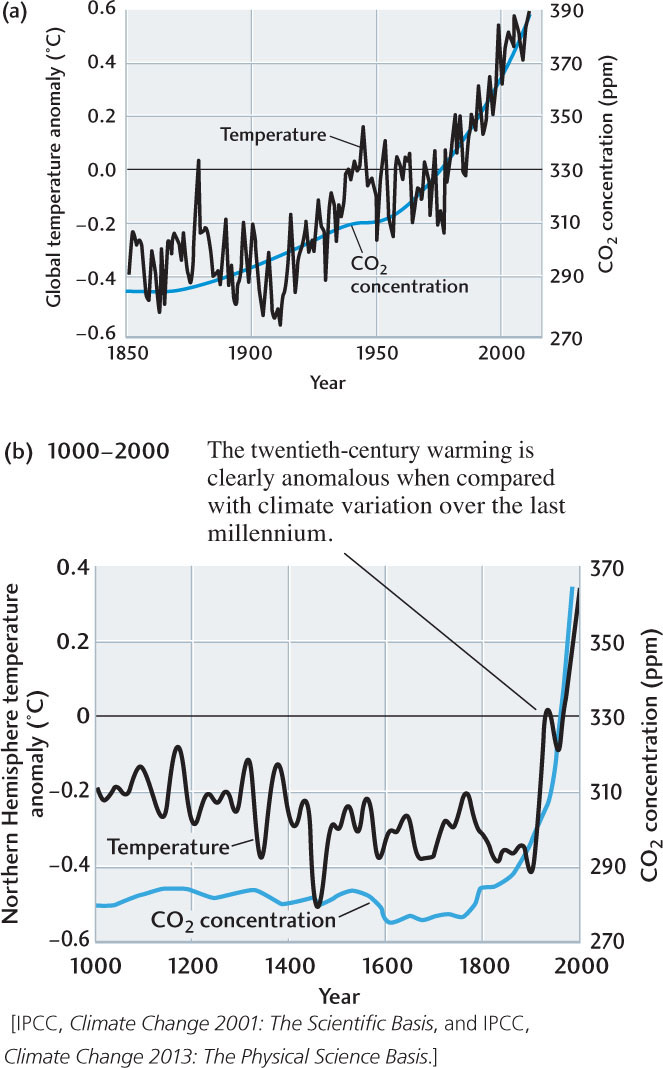
Although the average annual surface temperature fluctuates substantially from year to year and from decade to decade, the overall trend has been upward (Figure 15.21). Between the end of the nineteenth century and the beginning of the twenty-first, the average annual surface temperature rose by about 0.6°C (Figure 15.20a). This increase is referred to as the twentieth-century warming.
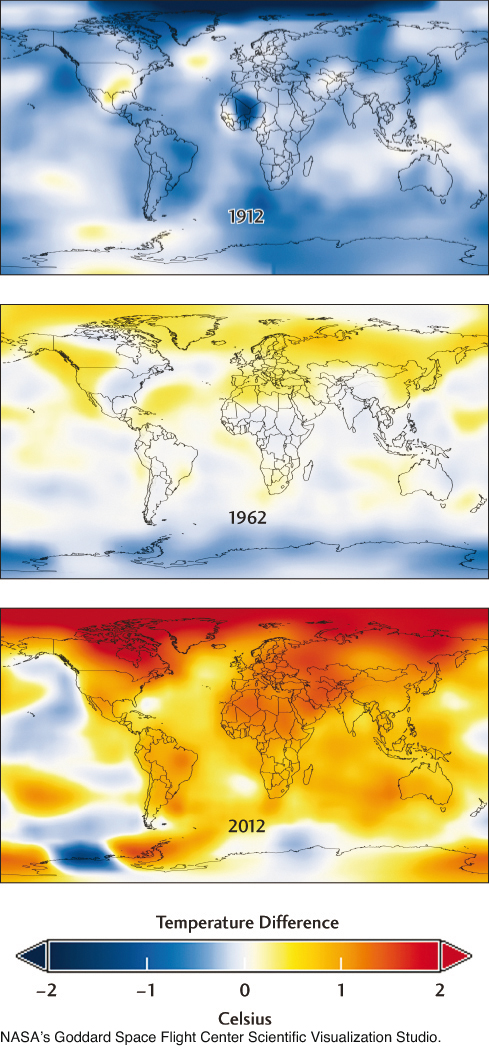
The twentieth-century warming was not uniform over the globe. Figure 15.22 shows the geographic variation of the yearly average temperatures for 1912, 1962, and 2012, colored according to the temperature differences relative to the baseline period 1951-1980. Globally averaged, the difference between 1912 and 2012 is about 0.8°C, consistent with the twentieth-century warming (compare with Figure 15.21). But some of the regional differences are larger, and some are smaller. In the arctic region, for example, the temperature rise has been several times higher than the mean value, whereas in the central Pacific Ocean, there has been very little. In general, the land surfaces have warmed more than the oceans. Most of the warming has occurred during the last 50 years. In large regions of the northern continents, the temperature rise between 1962 and 2012 has exceeded 1°C.
We know that human activities are responsible for the increasing concentrations of CO2 in the atmosphere because the carbon isotopes of fossil fuels have a distinctive ratio that precisely matches the changing isotopic composition of atmospheric carbon. But how certain can we be that the twentieth-century warming was a direct consequence of the anthropogenic CO2 increase—that is, a result of an enhanced greenhouse effect—and not some other kind of change associated with natural climate variation?
To answer this and other questions about how Earth’s climate is changing, the United Nations has set up a special scientific organization, the Intergovernmental Panel on Climate Change (IPCC), to review all research on climate and climate change. The IPCC is charged with developing a consensus, science-based view on how Earth’s climate has changed in the past and what might happen in the future, including the potential environmental and socioeconomic impacts of anthropogenic climate change. Much of the information about the climate system described in this textbook has been gleaned from the IPCC Assessment Reports (see Earth Issues 15.2).
The twentieth-century warming lies within the range of temperature variations that have been inferred for the Holocene. In fact, average temperatures in many regions of the world were probably warmer 10,000 to 8000 years ago than they are today. The twentieth-century record is clearly anomalous, however, when compared with the pattern and rate of climate change documented during the last millennium. Although direct temperature measurements are not available from before the nineteenth century, climate indicators such as ice cores and tree rings have allowed climatologists to reconstruct a temperature record for the Northern Hemisphere during that period (Figure 15.21b). That record shows an irregular but steady global cooling of about 0.2°C in the nine centuries between 1000 and 1900. It also shows that fluctuations in average surface temperature during each of these centuries were less than a few tenths of a degree.
429
430
Earth Issues: 15.2 The Intergovernmental Panel on Climate Change
Earth’s climate system is incredibly complex, so predicting its response to anthropogenic emissions of greenhouse gases is hardly a straightforward task. No one person can keep up with the vast amount of climate-change research that is being conducted worldwide by thousands of scientists, and even experts disagree on key points. In 1988, the United Nations (UN) and the World Meteorological Organization (WMO) established the Intergovernmental Panel on Climate Change (IPCC) to provide government leaders and the public at large with a clear scientific view of current knowledge about climate change and its potential environmental and socioeconomic impacts.
The IPCC is open to all UN and WMO members, and 195 countries are currently participating. The main product of the IPCC has been a series of Assessment Reports released every five to six years since 1990. Thousands of scientists from all over the world have contributed to the work of the IPCC on a voluntary basis as authors, contributors, and reviewers of these major reports. Each report in succession has laid out the most definitive scientific summaries of how climate has changed in the past and how it might change in the future.
IPCC’s First Assessment Report, published in 1990, played a key role in the creation of the United Nations Framework Convention on Climate Change, the main international treaty to reduce global warming and deal with the consequences of climate change. The IPCC Second Assessment Report of 1995 provided important material drawn on by negotiators of the Kyoto Protocol in 1997. The Third Assessment Report came out in 2001, and the Fourth in 2007.
The Fifth Assessment Report, which is currently in production, will comprise subreports from the three IPCC working groups. The first, entitled The Physical Science Basis of Climate Change, was released in draft form in September 2013 and runs to more than 2000 pages. Many of the basic data on climate change described in this chapter and elsewhere in this textbook have been updated according to this 2013 IPCC assessment. The final version of the Fifth Assessment, which will include reports on Climate Change Impacts, Adaptation and Vulnerability and Mitigation of Climate Change, is scheduled for release in 2014.
In 2007, the Nobel Peace Prize was awarded jointly to the IPCC and Al Gore “for their efforts to build up and disseminate greater knowledge about man-made climate change, and to lay the foundations for the measures that are needed to counteract such change.”
The second argument, and to many scientists a more compelling one, comes from the agreement between the observed pattern of warming and the pattern predicted by the best climate models. Models that include changes in atmospheric greenhouse gas concentrations not only reproduce the twentieth-century warming, but also reproduce the observed patterns of temperature change both geographically and with altitude in the atmosphere—what some scientists have called the “fingerprints” of the enhanced greenhouse effect. For example, these models predict that as enhanced greenhouse warming occurs, nighttime low temperatures at Earth’s surface should increase more rapidly than daytime high temperatures, thus reducing daily temperature variation. Climate data for the last century confirm this prediction.
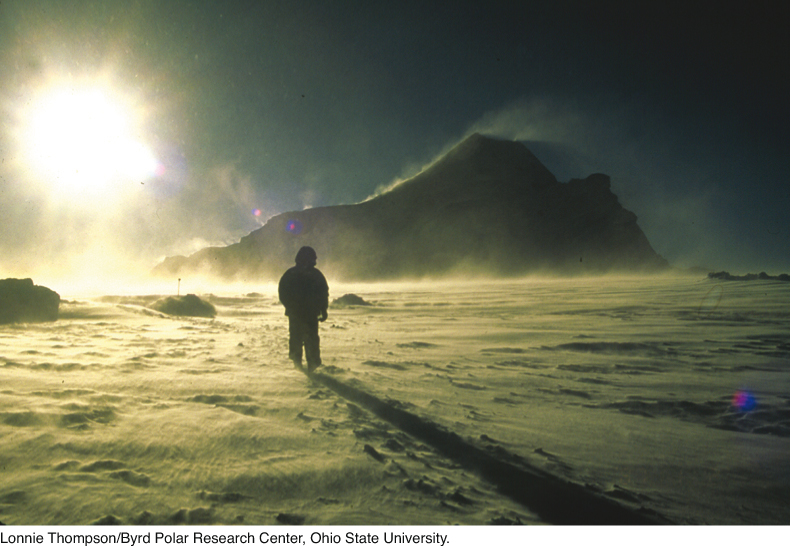
Another fingerprint of global warmer has been the changes seen in mountain glaciers at lower latitudes. Glaciers found above 5000 m in Africa, South America, and Tibet (Figure 15.23) have been shrinking during the last hundred years, an observation that is also consistent with the predictions of climate models.
As we emphasized earlier in this chapter, aspects of the climate system that are still poorly understood may introduce substantial errors into the predictions of climate models. Nevertheless, the consistency of the measured trends with the basic physics of the enhanced greenhouse effect lends powerful support to the hypothesis that we ourselves are the agents responsible for the recent global warming. We will discuss global warming further, and look at the societal problems it poses, in Chapter 23.
431