Practicing Geology Exercise
Balancing Carbon Emission with Carbon Accumulation: The Case of the Missing Sink
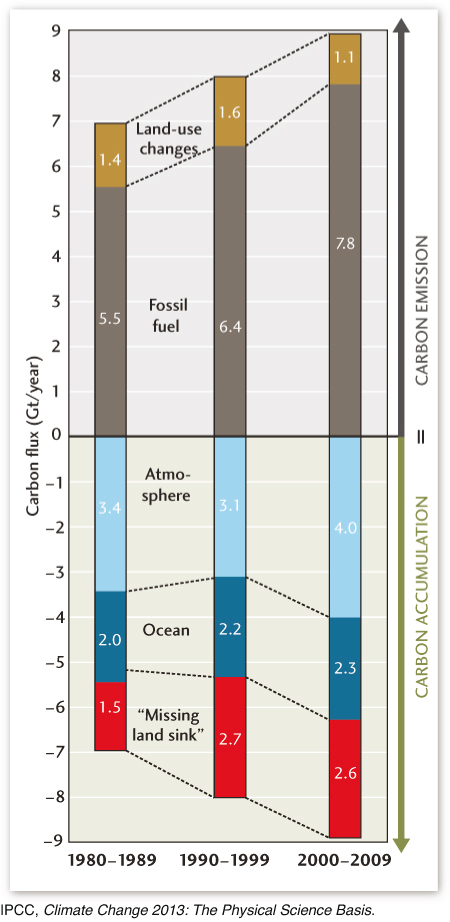
Understanding how humans are changing the carbon cycle is one of the most pressing issues in Earth science today because it holds the key to learning to manage anthropogenic global change. We can see from Figure 15.19 that, of the 8.9 Gt/year of carbon emitted by humans in 2000–2009, 2.6 Gt/year—almost a third—was absorbed by the land surface. Plant photosynthesis and respiration dominate the exchange of CO2 between the atmosphere and the land surface, so an increase in the rate of photosynthesis by land plants must clearly be the cause. But where on Earth is this happening? This question was so hard to answer that scientists for years called it the “missing sink” problem. The answer turns out to be important, because future treaties in which nations agree to regulate their carbon emissions will need to take into account all carbon sources and sinks within each nation’s boundaries.
As shown in the accompanying figure, the total anthropogenic carbon emissions rose from an average of 6.9 Gt/year in the 1980s, to 8.0 Gt/year in the 1990s, to 8.9 Gt/year in the 2000s. The rate at which these atmospheric emissions were absorbed into the ocean also increased, so that the percentage captured by the oceans remained nearly constant. However, the fraction of anthropogenic carbon accumulating in the atmosphere was not nearly so steady; in fact, the rate actually went down between the 1980s and 1990s from 3.4 Gt/year to 3.1 Gt/year, and then jumped to 4.0 Gt/year in the 2000s.
Atmospheric accumulation varies inversely with the carbon absorbed by the missing sink. The total amount of carbon is conserved; therefore, when summed over all geochemical reservoirs, carbon accumulation must balance carbon emission, as shown graphically by the bar charts in the figure. This balance allows us to calculate the amount of carbon absorbed by the missing sink:

The values are given by the red bars in the figure. Carbon absorption by the missing sink increased by 80 percent from 1.5 Gt/year in the 1980s to 2.7 Gt/year in the 1990s, and then decreased slightly to 2.6 Gt/year in the 2000s.
433
An obvious place to look for the missing carbon is in the world’s forests, which account for about half the annual terrestrial uptake of CO2 by photosynthesis. Forests are classified according to the average annual temperature where they grow as boreal (−5°C to 5°C), temperate (5°C to 20°C), or tropical (20°C to 30°C). Early models suggested that the growth of temperate forests might account for most of the missing carbon. However, data in the IPCC’s Fifth Assessment Report indicate that the current carbon accumulation is almost as large in the boreal regions and actually greater in the tropical regions.
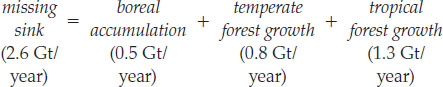
This newer model suggests that tropical forest growth (1.3 Gt/year) is more than offsetting tropical deforestation, which accounts for most of the carbon emissions from land-use changes (1.1 Gt/year).
Although progress is being made, the carbon--balance problem is far from solved. Because of the measurement difficulties, all estimates of where carbon is accumulating have large uncertainties, so more research is needed to pin down the numbers. Nevertheless, these estimates not only demonstrate the importance of our forests as carbon sinks, but also raise major policy issues about how they should be managed. For example, how much “carbon credit” should nations such as the United States and Brazil receive for the carbon taken up by their forests? Such issues will figure prominently in the negotiation of international treaties to deal with anthropogenic global change.
BONUS PROBLEM: From the data shown in the figure, calculate the net carbon flux from the land surface by balancing the carbon emitted by land-use changes with the carbon absorbed by the missing sink. In the three decades shown, was this net carbon flux from the land surface positive (net emission) or negative (net absorption)? What factors might explain why the magnitude of this net flux increased steadily from the 1980s to the 2000s?