Streams as Geosystems
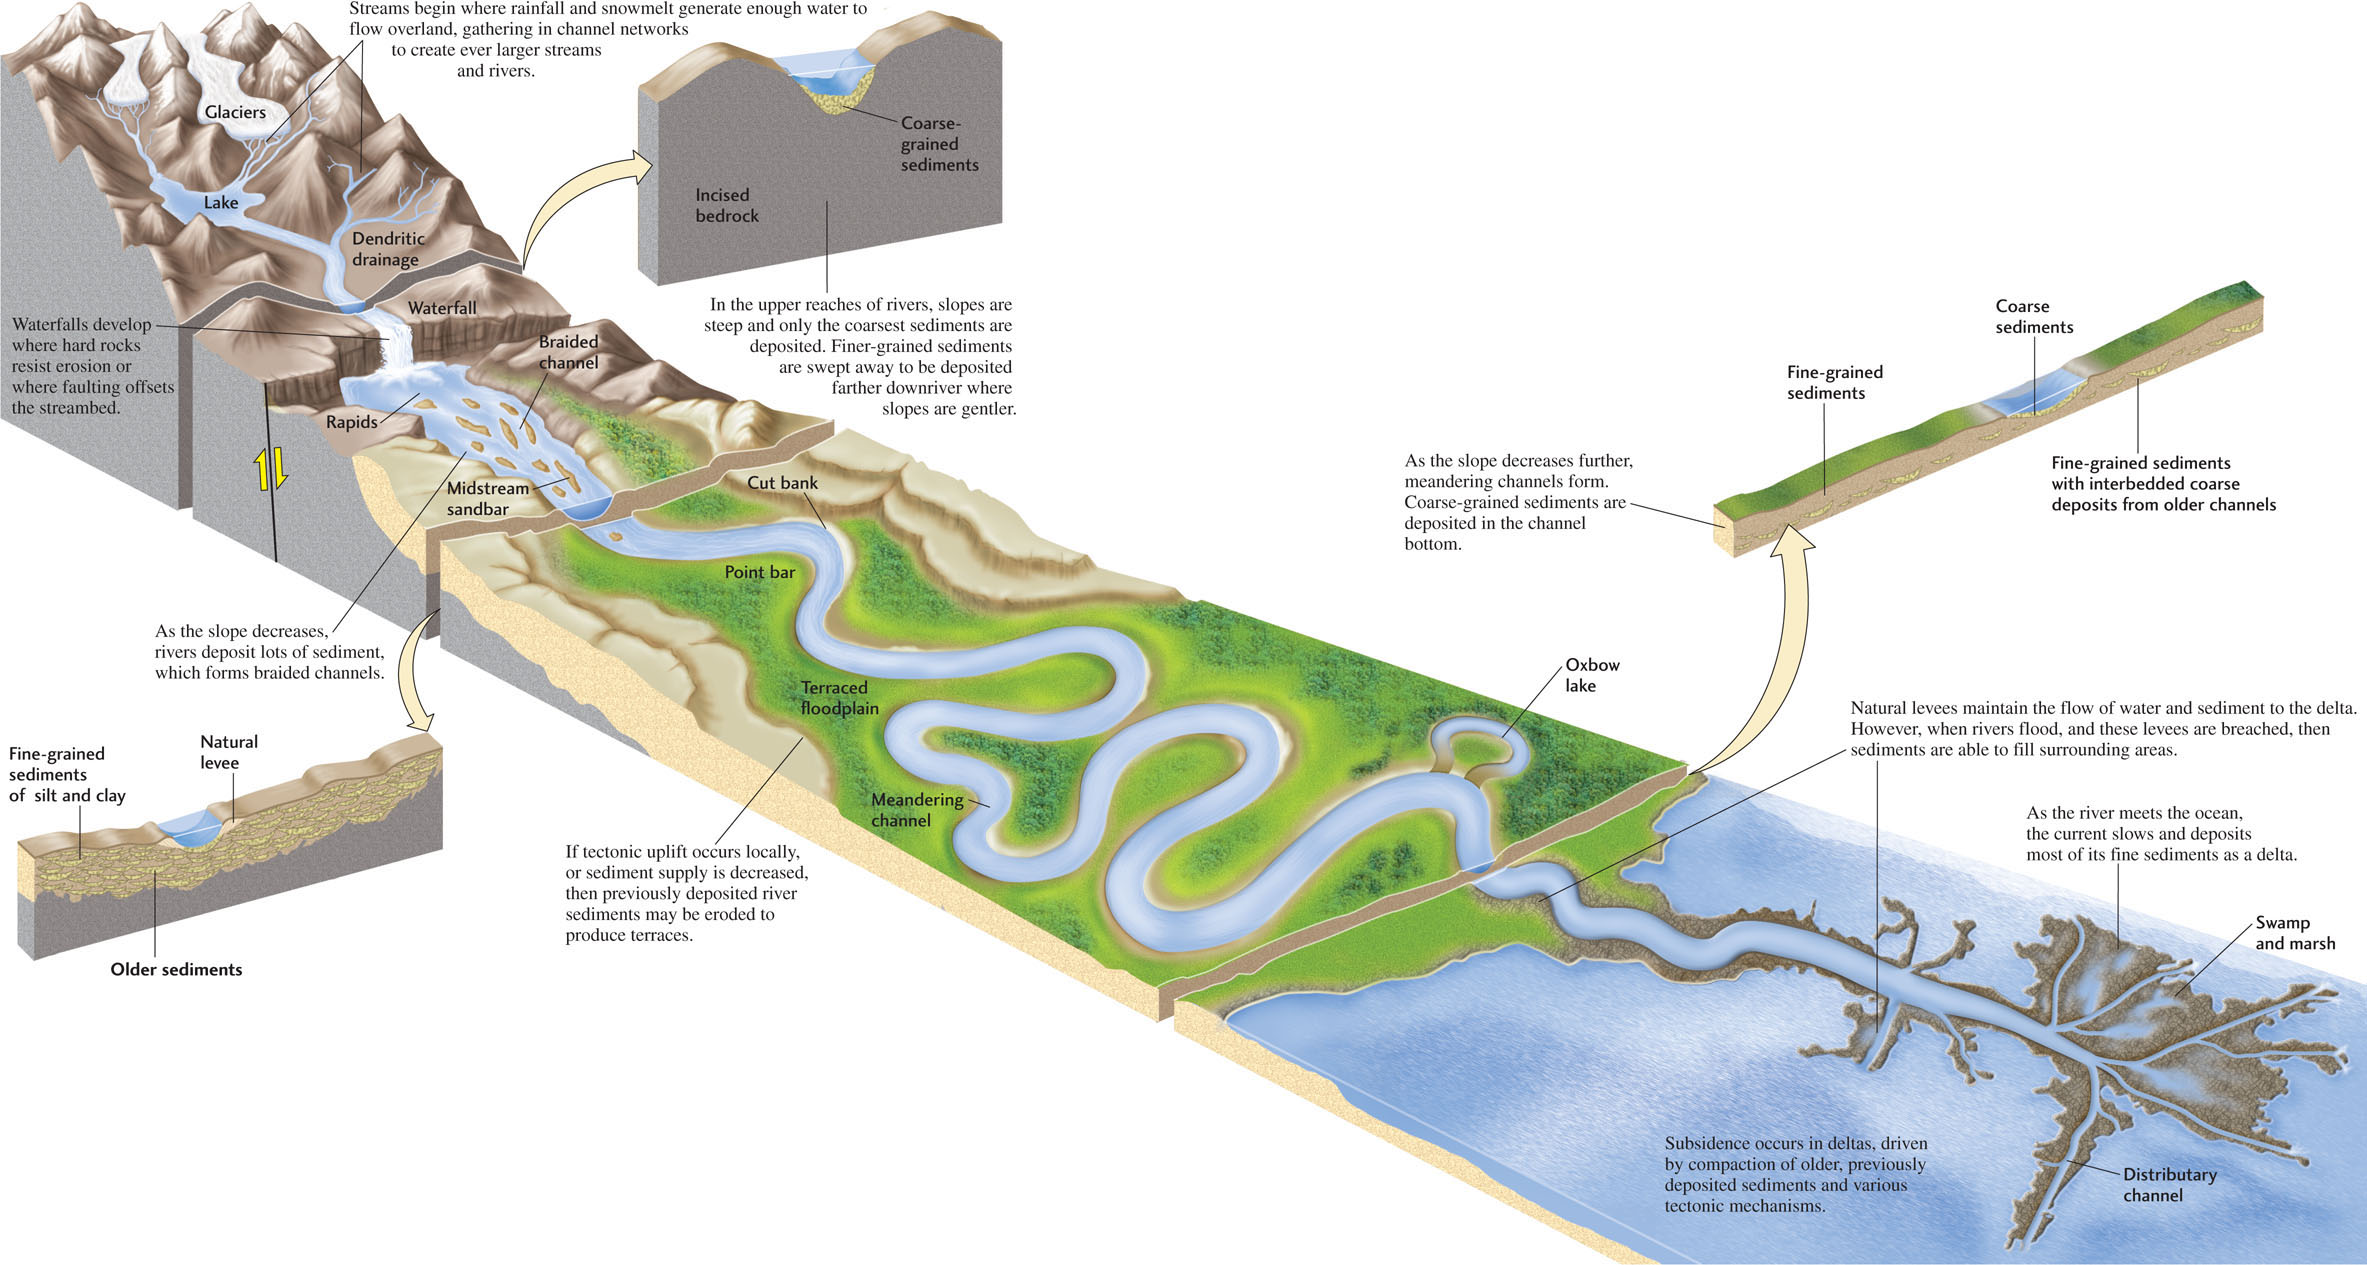
Streams are dynamic geosystems that are continually changing in response to the influences of climate and plate tectonic processes, and those changes, in turn, influence the transport of water and sediments. The flow of a stream may appear steady when you view it from a bridge for a few minutes or canoe along it for a few hours, but its volume and velocity may change appreciably from month to month and season to season. At any one location, the stream is constantly changing, shifting from low water to flood stage over a few hours or days and reshaping its valley over longer periods (Figure 18.20). The flow and channel dimensions of a stream also change as it moves downslope, from narrow valleys in its upland headwaters to broader floodplains in its middle and lower courses. Most of these longer-term changes are adjustments in the normal (nonflood) volume and velocity of the flow as well as in the depth and width of the channel.
From their headwaters to their mouths, all streams react to changes in climate (such as changes in precipitation) and to plate tectonic processes (such as uplift or subsidence of Earth’s crust). As we have seen, streams gather into ever larger streams, eventually forming a single large stream, as in the case of the Mississippi River. Precipitation in the headwaters may affect streamflow far downriver, where a river’s volume may exceed the volume of the channel and then spill over the banks to create a flood. In this way, processes and events in one part of the stream network are propagated through the system to affect the behavior of a different part of the system.
Sediment transport changes in a similar way, though over a longer time scale. If precipitation in the headwaters increases over a long period—say, because the climate becomes rainier—or tectonic uplift rates increase, erosion rates and sediment yields increase. The stream network propagates a “wave” of sediment that eventually reaches the delta, where it may be preserved in the rock record as an interval of unusually high sediment accumulation. We will further explore these relationships and their effects on landscape development in Chapter 22.
516
Several factors are important in controlling how water and sediments move through stream geosystems. These factors include the stream’s discharge, its longitudinal profile, and changes in its base level.
Discharge
We can measure the size of a stream’s flow by its discharge: the volume of water that passes a given point in a given time as it flows through a channel of a certain width and depth. (In Chapter 17, we defined discharge as the volume of water leaving an aquifer in a given time. These definitions are consistent because they both describe volume of flow per unit of time.) Stream discharge is usually measured in cubic meters per second (m3/s) or cubic feet per second. Discharge in small streams may vary from about 0.25 to 300 m3/s. The discharge of a well-studied medium-sized river in Sweden, the Klarälven, varies from 500 m3/s at low water levels to 1320 m3/s at high water levels. The discharge of the Mississippi River can vary from as little as 1400 m3/s at low water levels to more than 57,000 m3/s during floods.
Discharge is matched by recharge at any location where rainfall or discharging groundwater contributes to the stream. When recharge is less than discharge, such as during a drought, stream levels may fall dramatically. When recharge is greater than discharge, stream levels will rise, and flooding will occur if the imbalance between discharge and recharge becomes too great.
517
To calculate discharge, we multiply the cross-sectional area (the width multiplied by the depth of the part of the channel occupied by water) by the velocity of the flow (distance traveled per second):
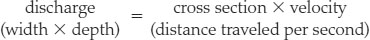
Figure 18.21 illustrates this relationship. If discharge is to increase, then either velocity or cross-sectional area, or both, must increase. Think of increasing the discharge of a garden hose by opening the valve more, which increases the velocity of the water coming out the end of the hose. The cross-sectional area of the hose cannot change, so the discharge must increase. In a stream, as discharge at a particular point increases, both the velocity and the cross-sectional area of the flow tend to increase. (The velocity is also affected by the slope of the channel and the roughness of the bottom and sides, which we can neglect for the moment.) The cross-sectional area increases because the flow occupies more of the channel’s width and depth.
518
Discharge in most rivers increases downstream as more and more water flows in from tributaries. Increased discharge means that width, depth, or velocity must increase as well. Velocity does not increase downstream as much as the increase in discharge might lead us to expect, however, because the slope along the lower courses of a stream decreases (and decreasing slope reduces velocity). Where discharge does not increase significantly downstream and slope decreases greatly, a river will flow more slowly.
Floods
A flood is an extreme case of increased discharge that results from a short-term imbalance between inflow and outflow. As discharge increases, the flow velocity in the channel increases, and the water gradually fills the channel. As discharge continues to increase, the stream reaches flood stage (the point at which water first spills over the banks).
Some streams overflow their banks almost every year when the snows melt or rains arrive; others flood at irregular intervals. Some floods bring very high water levels that inundate the floodplain for days. At the other extreme are minor floods that barely break out from the channel before they recede. Small floods are more frequent, occurring every 2 or 3 years on average. Large floods are generally less frequent, usually occurring every 10, 20, or 30 years.
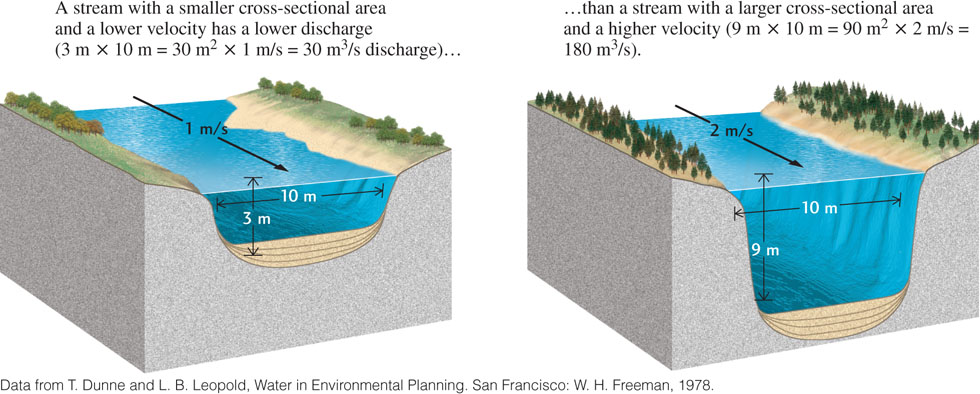
No one can know exactly how severe—either in water height or in discharge—a flood will be in any given year, so predictions are stated as probabilities, not certainties. For a particular stream, we might say that there is a 20 percent probability that a flood of a given discharge—say, 1500 m3/s—will occur in any one year. That probability corresponds to an average recurrence interval—in this case, 5 years (1 in 5 = 20 percent)—that we expect between two floods with a discharge of 1500 m3/s. We speak of a flood of this discharge as a 5-year flood. A flood of greater magnitude—say, 2600 m3/s—on the same stream is likely to happen only once every 50 years, and it would therefore be called a 50-year flood. As with earthquakes, floods of greater magnitudes have longer recurrence intervals. A graph of the annual probabilities and recurrence intervals of floods with a range of discharges is known as a flood frequency curve.
The recurrence interval of floods of a certain discharge depends on three factors:
- 1. The climate of the region
- 2. The width of the floodplain
- 3. The size of the channel
For a stream in a dry climate, for example, the recurrence interval of 2600 m3/s floods may be much longer than the recurrence interval of 2600 m3/s floods for a similar stream in an area that gets intermittent rain. For this reason, flood frequency curves for individual rivers are necessary if towns along those rivers are to be prepared to cope with flooding. A flood frequency curve for one river—the Skykomish, in Washington State—is shown in Figure 18.22.
The prediction of river floods and their heights has become much more reliable as automated rainfall gauges and streamgauges, coupled with new computer models, have come into use. Geologists can now forecast the rise and fall of river levels as much as several months in advance, and they can issue reliable flood warnings days in advance. This information is useful for many other purposes as well, from water resource management to the planning of recreational river trips (see the Practicing Geology Exercise at the end of this chapter).
519
Longitudinal Profiles
We have seen that streamflow at any locality balances inflow and outflow, which become temporarily out of balance during floods. Studies of changes in discharge, flow velocity, channel dimensions, and topography along the entire length of a stream, from its headwaters to its mouth, reveal a larger-scale and longer-term balance. A stream is in dynamic equilibrium when erosion of the streambed balances sedimentation in the channel and floodplain over its entire length. This equilibrium is controlled by five factors:
- 1. Topography (especially slope)
- 2. Climate
- 3. Streamflow (including both discharge and velocity)
- 4. The resistance of rock in the streambed to weathering and erosion
- 5. Sediment load
A particular combination of these factors—such as steep slope, humid climate, high discharge and velocity, hard rock, and low sediment load—would mean that the stream is eroding a steep valley into bedrock and carrying downstream all sediment derived from that erosion. Downstream, where the slope is lower and the stream flows over easily erodible sediments, it would deposit sandbars and floodplain sediments, building up the elevation of the streambed by sedimentation.
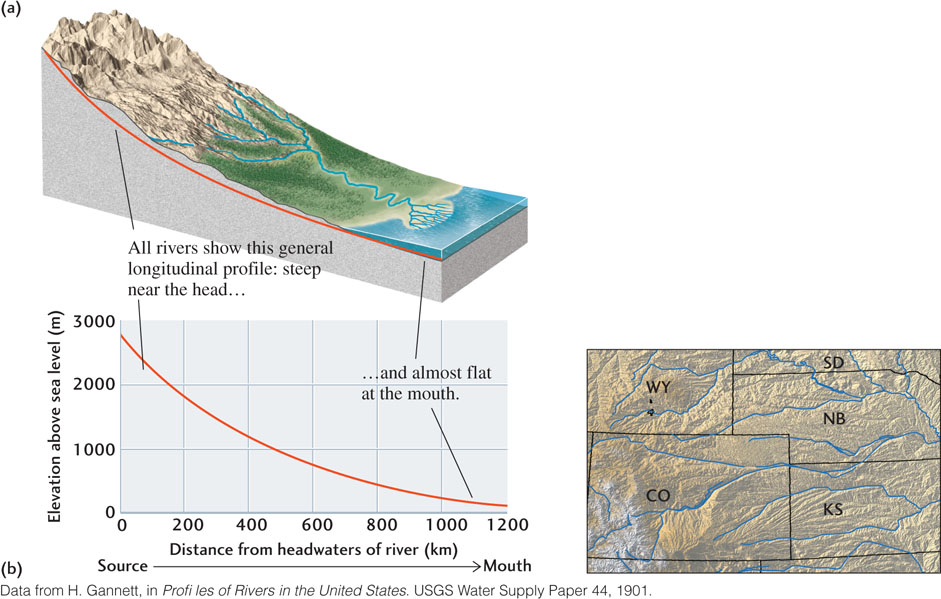
We can describe the longitudinal profile of a stream from headwaters to mouth by plotting the elevation of its streambed against distance from its headwaters. Figure 18.23 plots the slope of the Platte and South Platte rivers from the headwaters of the South Platte in central Colorado to the mouth of the Platte where it enters the Missouri River in Nebraska. The longitudinal profiles of all streams, from small rills to large rivers, form a similar smooth, concave-upward curve, from notably steep near the stream’s headwaters to low, almost level, near its mouth.
520
Why do all streams follow this profile? The answer lies in the combination of factors that control erosion and sedimentation. All streams run downslope from their headwaters to their mouths. Erosion is greater in the higher parts of a stream’s course than in the lower parts because slopes are steeper and flow velocities are higher, and both of these factors have an important influence on the erosion of bedrock (as we’ll see in Chapter 22). In a stream’s lower courses, where it carries sediments derived from erosion of the upper courses, erosion decreases and sedimentation increases. Differences in topography and the other factors listed above may make the longitudinal profile of an individual stream steeper or shallower, but the general shape remains a concave-upward curve.
Base Levels
The longitudinal profile of a stream is controlled at its lower end by the stream’s base level: the elevation at which it ends by entering a large standing body of water, such as a lake or ocean, or another stream. Streams cannot cut below their base level because the base level is the “bottom of the hill”—the lower limit of the longitudinal profile.
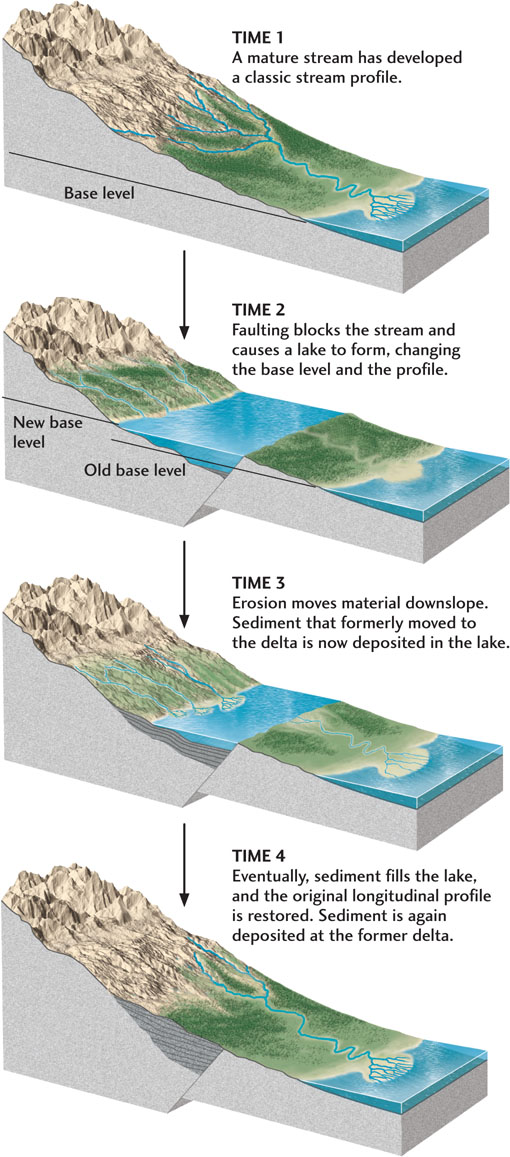
When tectonic processes change the base level of a stream, that change affects its longitudinal profile in predictable ways. If the regional base level rises—perhaps because of faulting—the profile will show the effects of sedimentation as the stream builds up channel and floodplain deposits to reach the new, higher regional base-level elevation (Figure 18.24).
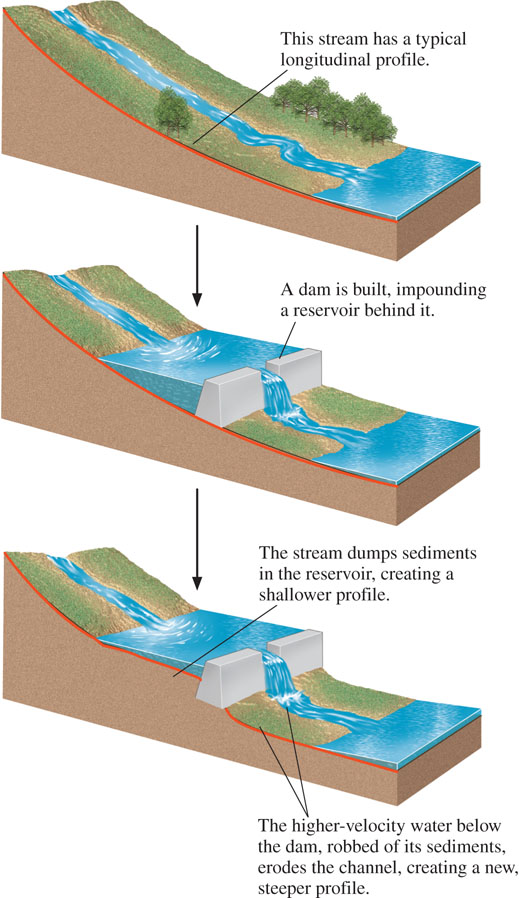
Damming a stream artificially can create a new local base level, with similar effects on the longitudinal profile (Figure 18.25). The slope of the stream upstream from the dam decreases because the new local base level artificially flattens the stream’s profile at the location of the reservoir formed behind the dam. The decrease in slope lowers the stream’s velocity, decreasing its ability to transport sediment. The stream deposits some of the sediment on the bed, which makes the concavity somewhat shallower than it was before the dam was built. Below the dam, the stream, now carrying much less sediment, adjusts its profile to the new conditions and typically erodes its channel in the section just below the dam.
This kind of erosion has severely affected sandbars and beaches in Grand Canyon National Park downstream from the Glen Canyon Dam. The erosion threatens animal habitats and archaeological sites as well as beaches used for recreation. River specialists calculated that if discharge during floods were increased by a certain amount, enough sand would be deposited to prevent depletion by erosion. This calculation was confirmed by an experiment in which a controlled flood was staged at the Glen Canyon Dam in 1996. As the gates of the dam were opened, about 38 billion liters of water spilled into the canyon at a rate fast enough to fill Chicago’s 100-story Willis (formerly Sears) Tower in 17 minutes. This experiment showed that eroded areas could be restored by sedimentation during floods.
Falling sea level also alters regional base levels and longitudinal profiles. The regional base levels of all streams flowing into the ocean are lowered, and their valleys are cut into former stream deposits. When the drop in sea level is large, as it was during the last ice age, rivers erode steep valleys into coastal plains and continental shelves.
521
Graded Streams
Over the years, a stream’s longitudinal profile becomes stable as the stream gradually fills in low spots and erodes high spots, thereby producing the smooth, concave-upward curve that represents the balance between erosion and sedimentation. That balance is governed not only by the stream’s base level, but also by the elevation of its headwaters and by all the other factors controlling the dynamic equilibrium of the stream. At equilibrium, the stream is a graded stream: one in which the slope, velocity, and discharge combine to transport its sediment load, with neither net sedimentation nor net erosion in the stream or its floodplain. If the conditions that produce a particular graded stream change, the stream’s longitudinal profile will change to reach a new equilibrium. Such changes may include changes in depositional and erosional patterns and alterations in the shape of the channel.
In places where the regional base level is constant over geologic time, the longitudinal profile represents the balance between tectonic uplift and erosion on the one hand and sediment transport and deposition on the other—in other words, the stream is graded. If uplift is dominant, typically in the upper courses of a stream, the longitudinal profile is steep and expresses the dominance of erosion and transport. As uplift slows and the headwater region is eroded, the profile becomes shallower.
Effects of Climate
Climate affects the longitudinal profile of a stream, primarily through the influences of temperature and precipitation on weathering and erosion (see Chapter 16). Warm temperatures and high rainfall promote weathering and erosion of soils and hillslopes and thus enhance sediment transport by streams. High rainfall also leads to greater discharge, which results in more erosion of the streambed. An analysis of sediment transport over the entire United States provides evidence that global climate change over the past 50 years is responsible for a general increase in streamflow. Short-term buildup of sediment or erosion may be the result of climate change, primarily variations in temperature.
Alluvial Fans
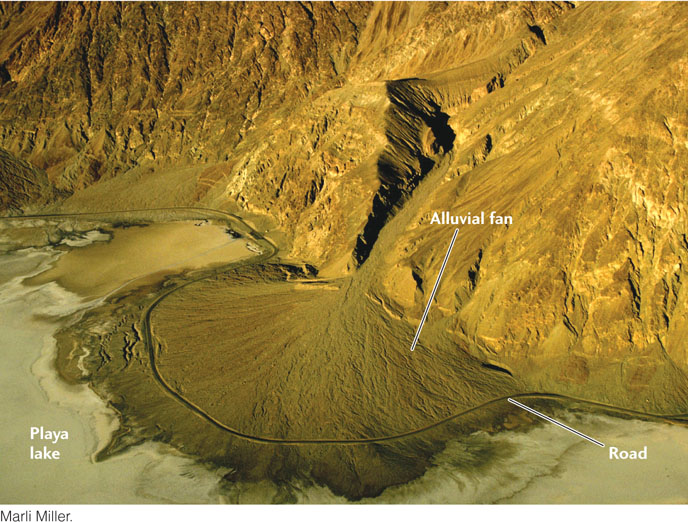
Plate tectonic processes can force changes in the longitudinal profile of a stream in a number of ways. One place where a stream must adjust suddenly to changed conditions is at a mountain front, where a mountain range abruptly meets gently sloping plains. Here, streams leave narrow mountain valleys and enter broad, relatively flat valleys at lower elevations. Along sharply defined mountain fronts, typically at steep fault scarps, streams drop large amounts of sediment in cone- or fan-shaped accumulations called alluvial fans (Figure 18.26). This deposition results from the sudden decrease in current velocity that occurs as the channel widens abruptly. To a minor extent, the lowering of the slope below the front also slows the stream. The surface of the alluvial fan typically has a concave-upward shape connecting the steeper mountain profile with the gentler valley profile. Coarse materials, from boulders to sand, dominate on the steep upper slopes of the fan. Lower down, finer sands, silts, and muds are deposited. Fans from many adjacent streams along a mountain front may merge to form a long wedge of sediment whose appearance may mask the outlines of the individual fans that make it up.
Terraces
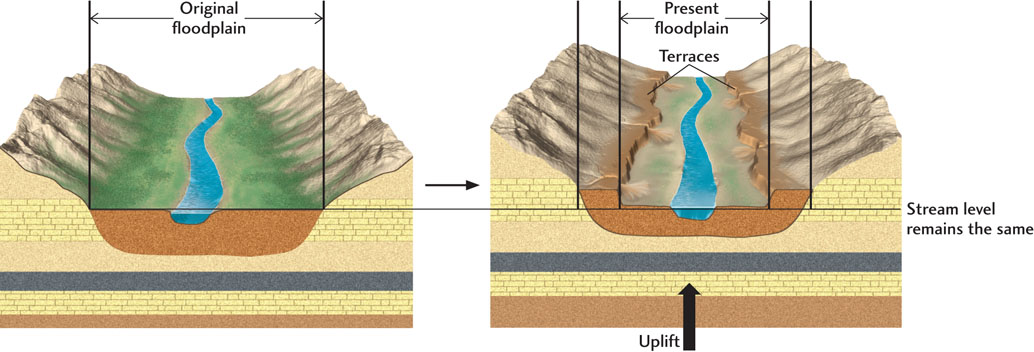
Tectonic uplift can result in flat, steplike surfaces in a stream valley that line the stream above the floodplain. These terraces mark former floodplains that existed at a higher level before regional uplift or an increase in discharge caused the stream to erode into its former floodplain. Terraces are made up of floodplain deposits and are often paired, one on each side of the stream, at the same elevation (Figure 18.27). Terrace formation starts when a stream creates a floodplain. Rapid uplift then changes the stream’s equilibrium, causing it to cut down into the floodplain. In time, the stream reestablishes a new equilibrium at a lower level. It may then build another floodplain, which will also undergo uplift and be sculpted into another, lower pair of terraces.
522
Lakes
Lakes are accidents of a stream’s longitudinal profile, as we can see easily where a lake has formed behind a dam (see Figure 18.25). Lakes form wherever the flow of a stream is obstructed. They range in size from ponds only 100 m across to the world’s largest and deepest lake, Lake Baikal in southwestern Siberia, which holds approximately 20 percent of the total fresh water in the world’s lakes and rivers. It is located in a continental rift zone, a typical plate tectonic setting for lakes. The damming that takes place in a rift valley results from faulting that blocks a normal exit of water (see Figure 18.24). Streams can flow into a rift valley easily, but cannot flow out until water builds up to a high enough level to allow them to exit. Similarly, a great many lakes formed in the northern United States and Canada when glacial ice and glacial sediments disrupted normal stream drainage. Sooner or later, if plate tectonics and climate remain stable, such lakes will drain away as new outlets form and the longitudinal profile of the streams becomes smoother.
Because lakes are so much smaller than oceans, they are more likely than oceans to be affected by water pollution. Chemical and other industries have polluted Lake Baikal. In North America, Lake Erie has been polluted for many years, although there has been some improvement recently.
523