Practicing Geology Exercise
Can We Paddle Today? Using Streamgauge Data to Plan a Safe and Enjoyable River Trip
How do geologists measure and record the flow of water in streams and rivers? In the United States, the U.S. Geological Survey (USGS) has been tracking water flow information for over a hundred years. The USGS uses streamgauges to measure and record the height of the water surface at repeated intervals (hourly, daily, weekly, or longer). In 2007, it operated and maintained more than 7400 streamgauges on rivers and streams across the nation. Geologists use USGS streamgauge data to manage the nation’s water resources in a number of ways: to forecast floods and droughts, to manage and operate dams and artificial reservoirs, and to protect water quality, among others.
The ready availability of USGS streamgauge data can also make for safer and more enjoyable outings for anglers, kayakers, canoeists, and rafters. Many USGS-maintained streamgauges transmit near-real-time data through a satellite or telephone network directly to a Web site. Streamgauge data are updated at intervals of 4 hours or less and are available to the public on the Internet at http://water.usgs.gov.
Checking streamgauge data before a river trip can prevent the disappointment and loss of time associated with a long drive to a favorite paddling spot, only to find the water too low or too fast to paddle. On the other hand, paddlers may be willing to travel farther for a river run when they know that flow conditions on their favorite river are optimal. The USGS data allow paddlers to match the conditions of the water to their own abilities.
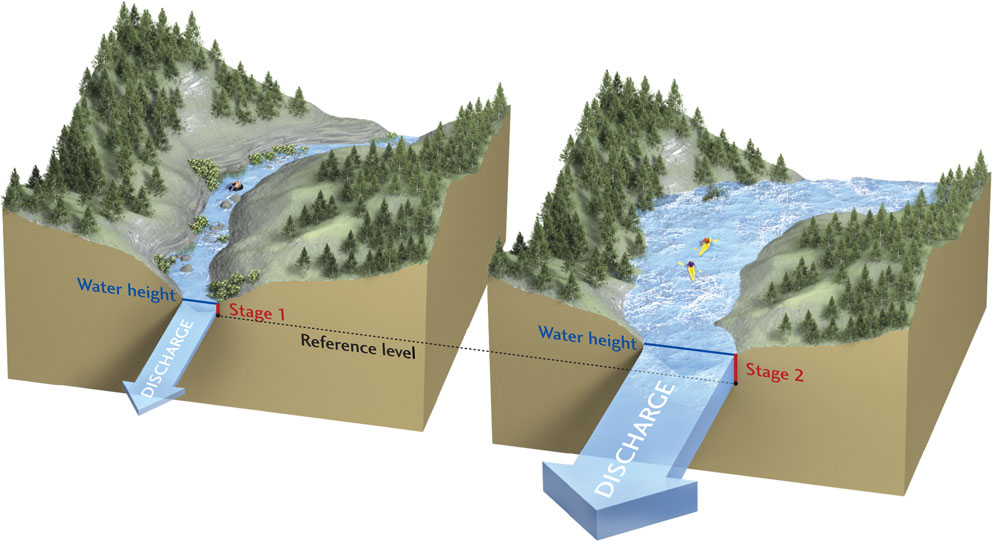
Streamgauges record the height of the water surface, often known as stage. The use of stage alone, however, can be misleading. “Stage” refers to the water surface elevation above a fixed reference point near the streamgauge and may not correspond directly to water depth. Never assume a stage reading is the equivalent of the distance between the water´s surface and the streambed. Discharge is a more reliable indicator of the conditions that river enthusiasts will encounter.
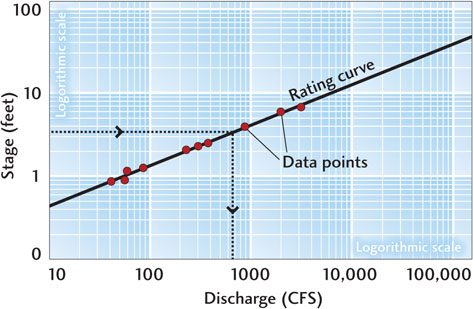
As discussed in the chapter text, the discharge of a stream is determined by measuring the cross-sectional area (width × depth) and velocity of the streamflow. The depth of the stream below the fixed reference point and its width at each streamgauge are known, so discharge can be estimated if velocity and stage are known. The discharge values from each measurement can be plotted against the stage recorded at the same time to develop a rating curve for each streamgauge. Paddlers can find the streamgauge reading for their favorite river run, then read the rating curve to get an estimate of the discharge.
526
Suppose you consult the USGS Web site and see that the most recent streamgauge reading for the river you want to paddle is 3 feet.
 Find 3 feet on the vertical axis of the accompanying graph and read across to the rating curve.
-
Then read down to find the discharge at a stage of 3 feet: 500 cubic feet per second (CFS).
As the discharge increases at a particular spot, a river will become increasingly challenging and eventually dangerous to recreationists. How high the discharge must become before extra caution is warranted can be known only through experience with the stretch of river that is to be used. Paddlers should consider keeping notes or a logbook on the conditions they encounter at various discharges on a particular stretch of the river to learn the river and to plan future trips.
Streamgauge and discharge data available on the USGS Web site also allow river recreationists to project likely conditions on the river over several days. For example, anglers may be interested in knowing when it will be safe to wade a river as flows decline following a heavy rainstorm or snowmelt. By monitoring near-real-time hydrographs (graphs of discharge over time) on the site, recreationists who are interested in river flows can monitor changing conditions to determine when the water is ideal for their sport and skill level.
BONUS PROBLEM: Try reading the rating curve yourself. What is the discharge that corresponds to a stage of 10 feet? A stage of 25 feet?
527