Practicing Geology Exercise
Does Beach Restoration Work?
Beach erosion is a problem facing many communities that have come to enjoy the scenic beauty of their beaches and depend on them to support tourism and economic development. Erosion of beaches is often driven by natural processes; in some cases, however, it has been greatly enhanced by failed engineering practices intended to prevent it. In recent years, scientists and engineers have pooled their efforts to create new approaches that have led to greater success in protecting beaches.
583
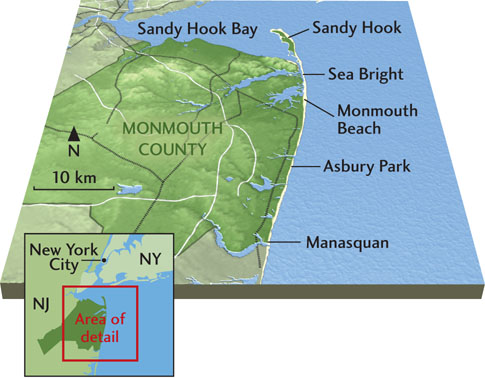
The beaches of Monmouth County, New Jersey, on the Atlantic coast of the United States, are among the most intensely studied on Earth. Human modification of these beaches commenced in 1870 with the construction of the New York and Long Branch Railroad. Access by railroad allowed tourism to develop and eventually permitted commuting to New York City by full-time residents, who began to alter the coastline. Concrete seawalls replaced beaches, and sand dunes and rock jetties were built about every quarter mile along the county’s 12-mile shoreline. Little by little over the next 100 years, the Monmouth County beaches became very narrow, until miles of shoreline were without a sand beach of any kind. The only bathing beaches were found in tiny pockets tucked into the corners made by the seawall and a jetty. Winter storms in 1991 and 1992 did substantial damage to the entire Monmouth County shoreline, driving the boardwalk back onto streets as splintered debris. Damage to homes occurred as the ocean easily overtopped the almost nonexistent beaches and insufficient seawalls.
By 1994, the state of New Jersey became serious about finding a solution to the beach erosion problem and appealed to the federal government for help. Congress subsequently authorized funding for the nation’s largest beach restoration project ever attempted, covering 20 miles of shoreline in Monmouth County, from the township of Sea Bright to Manasquan Inlet. The restoration project involved pumping enough sand from offshore areas to construct a restored beach 100 feet wide with an elevation of 10 feet above mean low water. The project includes periodic nourishment of the restored beaches on a 6-year cycle for 50 years from the start of the initial beach construction in 1994.
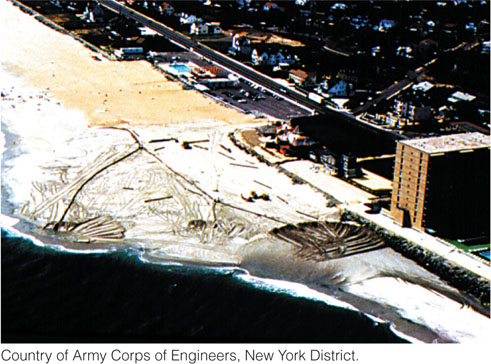
Beginning in 1994 and ending in 1997, 57 million cubic meters of sand were pumped from about a mile offshore, at a cost of $210,000,000. This initial placement volume provided a vast supply of new sand to the beaches of 9 out of 12 oceanfront municipalities. The earliest sites restored have responded well, requiring little sand augmentation since the project started.
At the outset, it was not obvious that the Monmouth County beach restoration project would succeed. Some people predicted total loss of the sand within a year or two. Nevertheless, the project has performed far better than all expectations. The results have been tracked by monitoring of changes in sand volume along a 13-km-long segment of the restoration zone.
The accompanying table provides a more quantitative sense of seasonal changes in sand volume along the shoreline due to erosion and deposition by natural processes. Monitoring of sand erosion and deposition on a seasonal basis between 1998 and 2004 has yielded an average value for cubic meters of sand lost (or gained) per meter of shoreline (m3/m) in each season. When this seasonal value is multiplied by the 13-km length of the shoreline, the change in the volume of the shoreline (m3) can be calculated. Note that in fall 2002, the shoreline was augmented by an additional, artificially supplied volume of sand. This maintenance fill was designed to offset the expected removal of sand by natural processes.

| Loss (−) or Gain (+) per Meter of Shoreline (m3) | Total Loss or Gain over Shoreline (m3/m) | Period |
| +1.41 | +18,330 | Fall 1998 |
| +0.16 | +2080 | Spring 1999 |
| −22.97 | −298,610 | Fall 1999 |
| −42.09 | −547,170 | Spring 2000 |
| −24.7 | −321,100 | Fall 2000 |
| −29.82 | −387,660 | Spring 2001 |
| −43.44 | −564,720 | Fall 2001 |
| −1.02 | −13,260 | Spring 2002 |
| +522.47 | +6,792,110 | Fall 2002* |
| −101.64 | −1,321,320 | Spring 2003 |
| −77.00 | −1,001,000 | Fall 2003 |
| −38.84 | −504,920 | Spring 2004 |
| −79.53 | −1,033,890 | Fall 2004 |
*This gain represents the maintenance fill in fall 2002.
From these data we can draw the following conclusions:
- 1. The shoreline lost an average of 20 m3/m of the initial placement volume per season from the time of initial placement through spring 2002. (This figure is the average of the first column of numbers up until the maintenance fill of fall 2002.)
- 2. The average seasonal shoreline loss rate increased to 74 m3/m following the maintenance fill of fall 2002. (This figure is the average of the first column of numbers after the maintenance fill of fall 2002.)
- 3. The shoreline experienced a net loss of 162 m3/m from the time of initial placement through spring 2002. (This figure is the average of the second column of numbers up until the maintenance fill of fall 2002.)
- 4. The shoreline experienced a net loss of 297 m3/m following the maintenance fill of fall 2002. (This figure is the average of the second column of numbers after the maintenance fill of fall 2002.)
It is not known what factors contributed to the increase in sand loss after 2002, but scientists would want to investigate processes such as increased frequency of storms or increased intensity of storms over that period.
Did the volume of sand provided by the maintenance fill of fall 2002 make up for the losses between 1998 and 2004? We can answer this question by summing the numbers in the second column of the table (5,973,240 m3) and comparing that sum with the volume of sand added in the maintenance fill of fall 2002 (6,792,110 m3). These numbers are close enough that we can conclude that the losses due to natural causes were balanced by the artificial maintenance fill.
BONUS PROBLEM: Given the total cost of the initial restoration project that was started in 1994, and the volume of sand that was pumped to the shoreline at that time, calculate the average cost per cubic meter of sand. Then use this value to estimate the cost of the maintenance fill that was provided in fall 2002. Do you think this continuing cost—every 6 years—is worth it?
