Coastal Processes
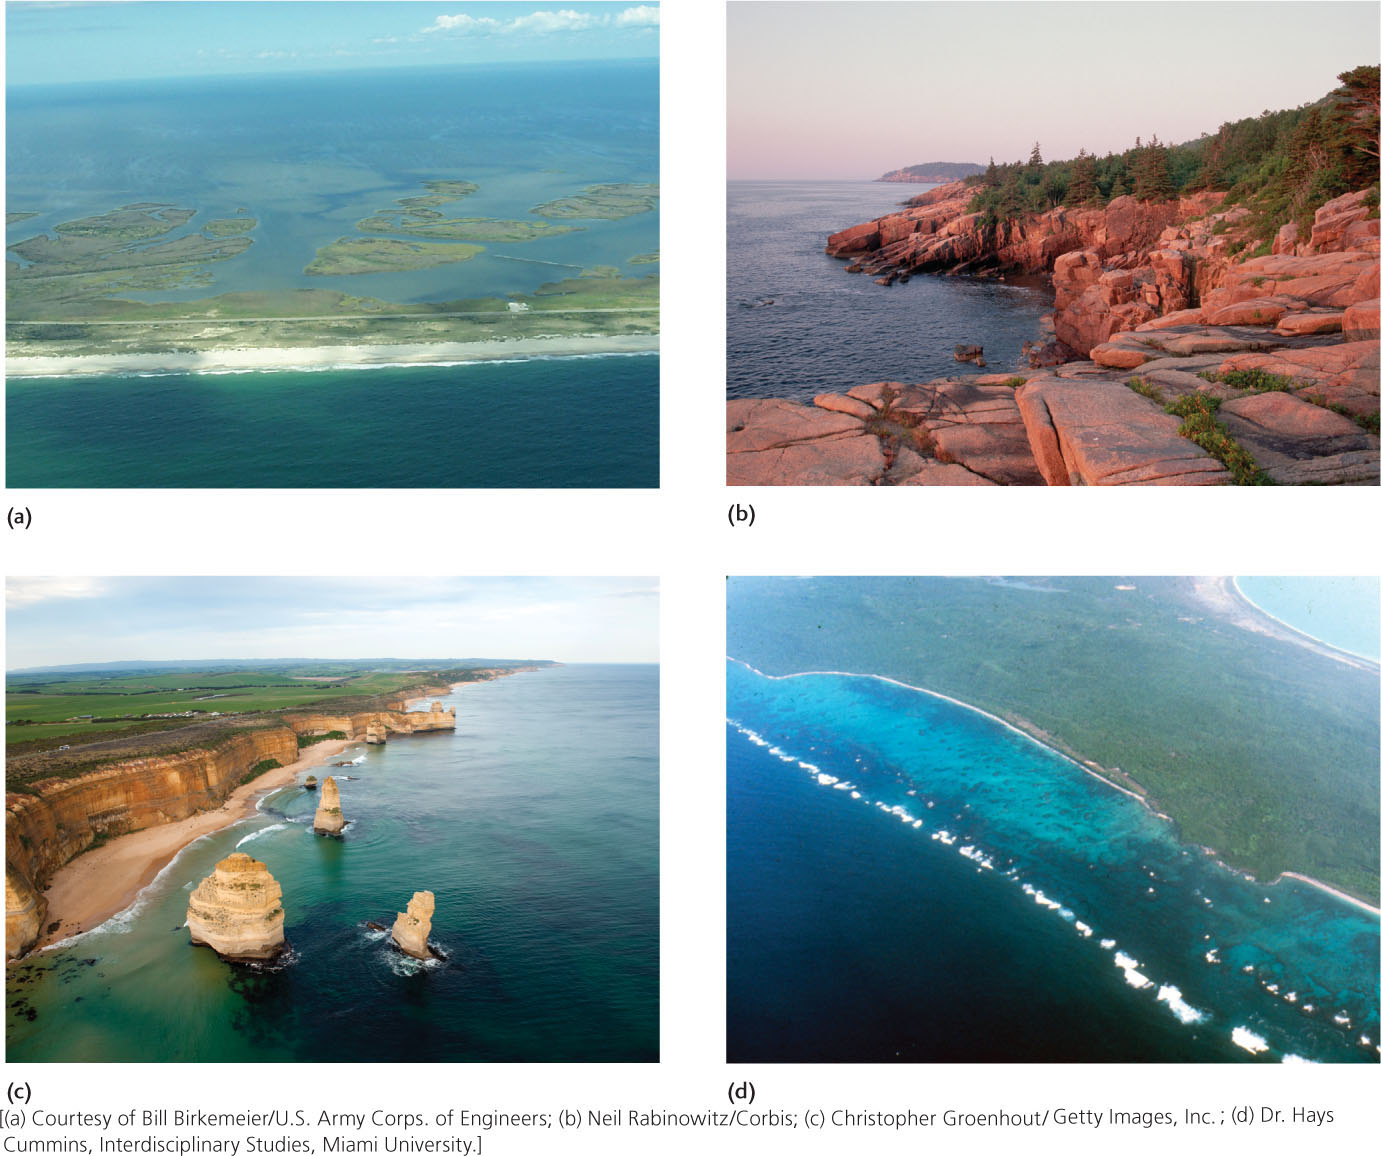
Coastlines are the broad regions where land and streams meet the ocean. Environmental problems such as coastal erosion and pollution of shallow waters make the geology of coastlines an active area of research. The landscapes of coastlines, even within a single continent, present striking contrasts (Figure 20.1). On the coast of North Carolina, for example, long, straight, sandy beaches stretch for miles along low coastal plains (Figure 20.1a). Here, tectonic activity is limited, and it is the currents produced by breaking waves that mold the coastline. The Oregon coastline, on the other hand, is dominated by rocky cliffs. Even though the effect of waves is considerable, it is tectonic uplift that shapes this landscape. Many of the seaward edges of islands in the tropics are coral reefs, shaped by biological sedimentation (Figure 20.1d). As we will see, plate tectonic processes, erosion, and sedimentation work together to create this great variety of coastline shapes and materials.
553
The major geologic forces operating at the shoreline—the line where the water surface meets the land surface—are ocean currents created by waves and tides. These currents eventually erode even the most resistant rocky shores. They also transport the sediments produced by erosion and deposit them on beaches and in shallow waters along the shore.
As we have seen in earlier chapters, currents are the key to understanding geologic processes at Earth’s surface, and coastal processes are no exception. Let’s examine the various types of currents that shape our shorelines.
Wave Motion: The Key to Shoreline Dynamics
Centuries of observation have taught us that waves are constantly changing. In quiet weather, waves with calm troughs between them roll regularly into shore. In the high winds of a storm, however, waves move in a confusion of shapes and sizes. They may be low and gentle far from shore, yet become high and steep as they approach land. High waves can break on the shore with fearful violence, shattering concrete seawalls and tearing apart houses built along the beach. To understand the dynamics of shorelines, and to make sensible decisions about coastal development, we need to understand how waves work.
554
Wind blowing over the surface of the ocean creates waves by transferring its energy of motion from air to water. As a gentle breeze of 5 to 20 km/hour starts to blow over a calm sea surface, ripples—little waves less than a centimeter high—take shape. As the speed of the wind increases to about 30 km/hour, the ripples grow to full-sized waves. Stronger winds create larger waves and blow off their tops to make whitecaps. The height of waves depends on three factors:
 The wind speed
-
The length of time over which the wind blows
-
The distance the wind travels over water
Storms blow up large, irregular waves that radiate outward from the storm center, like the ripples moving outward from a pebble dropped into a pond. As the waves travel outward in ever-widening circles, they become more regular, changing into low, broad, rounded waves called swell, which can travel hundreds of kilometers. Several storms at different distances from a shoreline, each producing its own pattern of swell, may account for the often irregular intervals between waves approaching the shore.
If you have seen waves in an ocean or a large lake, you have probably noticed how a piece of wood floating on the water moves a little forward as the crest of a wave passes and then a little backward as the trough between waves passes. Although it moves back and forth, the wood stays in roughly the same place—and so does the water around it. The water molecules move in a circle, even though the waves are moving toward the shore.
We can describe a wave form in terms of the following three characteristics (Figure 20.2):
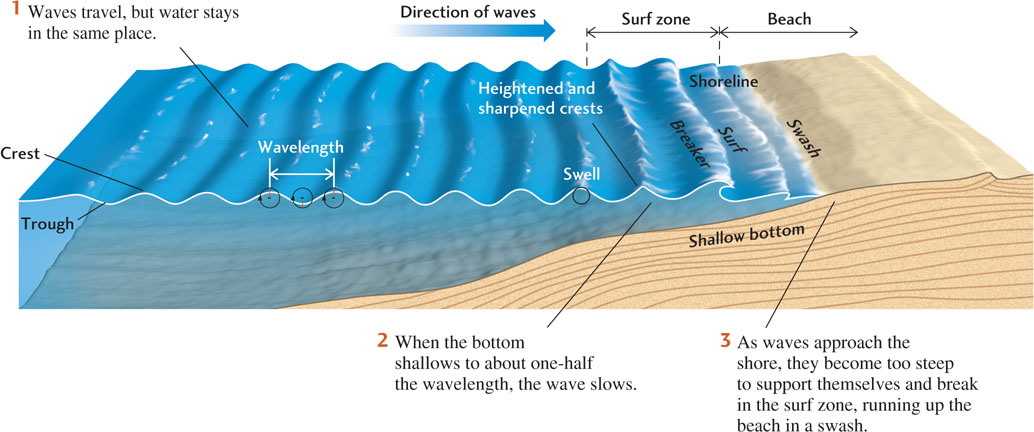
- 1. Wavelength, the distance between wave crests
- 2. Wave height, the vertical distance between the crest and the trough
- 3. Period, the time it takes for two successive wave crests to pass a fixed point
We can measure the velocity at which a wave moves forward by using a simple equation:

where V is the velocity, L is the wavelength, and T is the period. Thus, a typical wave with a length of 24 m and a period of 8 s would have a velocity of 3 m/s. The periods of waves range from just a few seconds to as long as 15 or 20 s, and their wavelengths vary from about 6 m to as much as 600 m. Consequently, wave velocities vary from 3 to 30 m/s. Wave motion becomes very small below a depth equal to about one-half the wavelength. That is why deep divers and submarines are unaffected by the waves at the surface.
The Surf Zone
Swell becomes higher as it approaches the shore, where it assumes the familiar sharp-crested wave shape. These waves are called breakers because, as they come closer to shore, they break and form surf—a foamy, bubbly surface. The surf zone is the belt along which breaking waves collapse as they approach the shore.
The transformation from swell to breakers starts where water depth decreases to less than one-half the wavelength of the swell. At that point, the wave motion just above the bottom becomes restricted because the water can only move back and forth horizontally. Above that, the water can move vertically just a little (see Figure 20.2). The restricted motion of the water molecules slows the whole wave. Its period remains the same, however, because the swell keeps coming in from deeper water at the same rate. From the wave equation, we know that if the period remains constant but the wavelength decreases, then the velocity must also decrease. The typical wave that we used as our example earlier might keep the same period of 8 s while its length decreased to 16 m, in which case it would have a velocity of 2 m/s. Thus, as waves approach the shore, they become more closely spaced, higher, and steeper, and their wave crests become sharper.
555
As a wave rolls toward the shore, it becomes so steep that the water can no longer support itself, and the wave breaks with a crash in the surf zone (see Figure 20.2). Gently sloping bottoms cause waves to break farther from shore; steeply sloping bottoms make waves break closer to shore. Where rocky shores are bordered by deep water, the waves break directly on the rocks with a force amounting to tons per square meter, throwing water high into the air (see the chapter opening photo). It is not surprising that concrete seawalls built to protect structures along the shore quickly start to crack and must be repaired constantly.
After breaking in the surf zone, the waves, now reduced in height, continue to move in, breaking again at the shoreline. They run up onto the sloping front of the beach, forming an uprush of water called swash. The water then runs back down again as backwash. Swash can carry sand and even large pebbles and cobbles onto the beach if the waves are high enough. The backwash carries the particles seaward again.
The back-and-forth motion of the water just offshore is strong enough to carry sand grains and even gravel. Wave action in water as deep as 20 m can move fine sand. Large waves caused by intense storms can scour the bottom at much greater depths, down to 50 m or more. At shallower depths, storms transport sediments in an offshore direction, often depleting beaches of their fine sand.
Wave Refraction
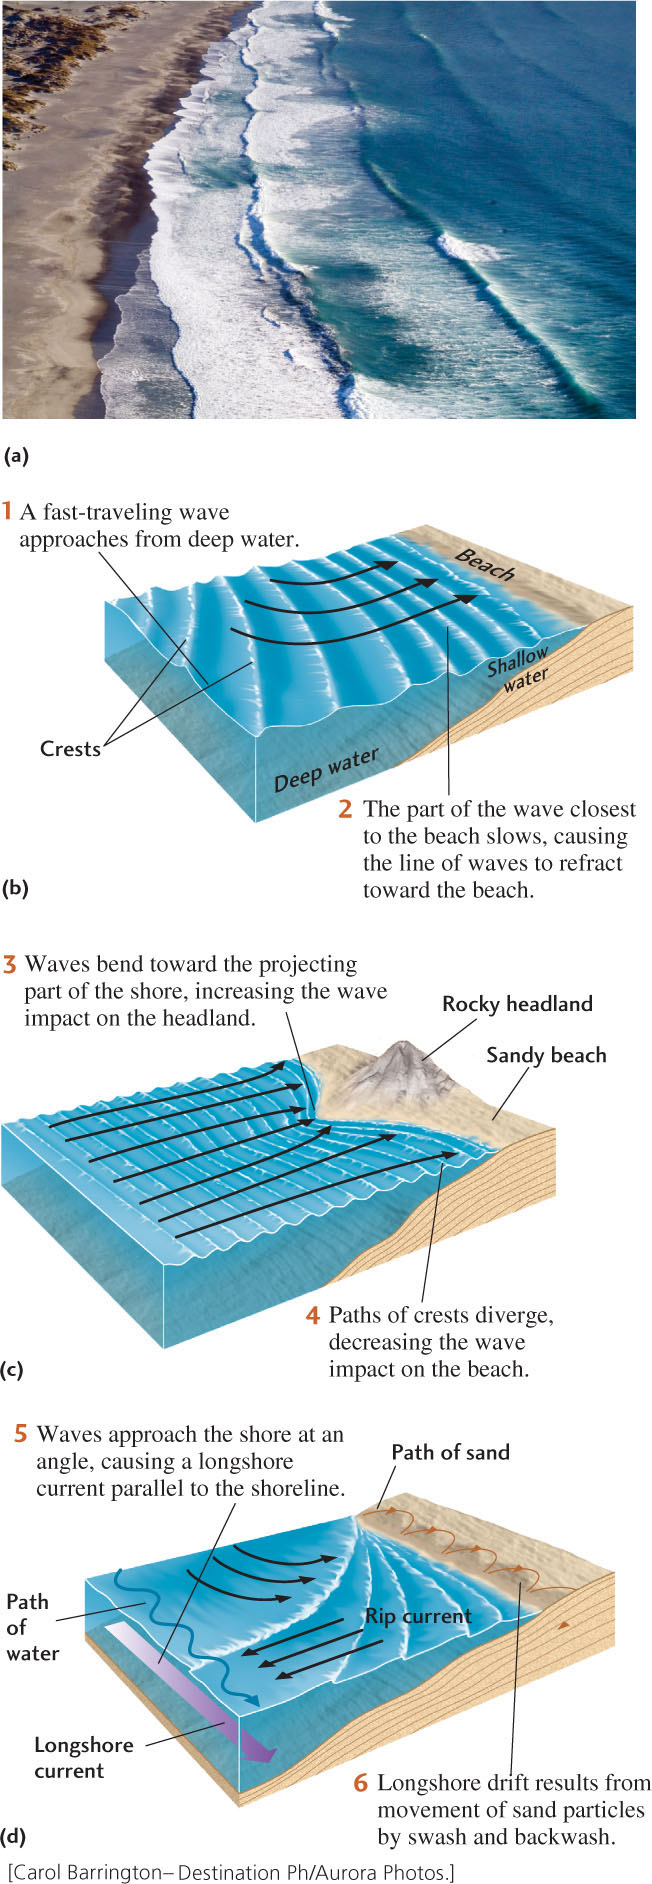
Far from shore, the lines of wave crests are parallel to one another, but are usually at some angle to the shoreline. As the waves approach the shore over a shallowing bottom, they gradually bend to a direction more parallel to the shore (Figure 20.3a). This bending is called wave refraction. It is similar to the bending of light rays in optical refraction, which makes a pencil half in and half out of water appear to bend at the water surface. Wave refraction begins as the part of a wave closest to the shore encounters the shallowing bottom first, and the front of the wave slows. Then the next part of the wave meets the bottom and it, too, slows. Meanwhile, the parts closest to shore have moved into even shallower water and have slowed even more. Thus, in a continuous transition along the wave crest, the line of waves bends toward the shore as it slows (Figure 20.3b).
556
Wave refraction results in more intense wave action on projecting headlands (Figure 20.3c) and less intense action in indented bays. The bottom becomes shallow more quickly around headlands than in the surrounding deeper water on either side. Thus, waves are refracted around headlands—that is, they are bent toward the projecting part of the shore on both sides. The waves converge around the headland and expend proportionally more of their energy breaking there than at other places along the shore. Because of this concentration of wave energy at headlands, they tend to be eroded more quickly than straight sections of shoreline.
The opposite happens as a result of wave refraction in a bay. The waters in the center of the bay are deeper, so the waves are refracted on either side into shallower water. The energy of wave motion is diminished at the center of the bay, which makes bays good harbors for ships.
Although refraction makes waves more parallel to the shore, most waves still approach it at some small angle. As the waves break on the shore, the swash moves up the beach slope in a direction perpendicular to that small angle. The backwash runs down the slope in the opposite direction at a similar small angle. The combination of these two motions moves the water a short way down the beach (Figure 20.3d). Sand grains carried by swash and backwash are thus moved along the beach in a zigzag motion known as longshore drift.
Waves approaching the shoreline at an angle can also cause a longshore current, a shallow-water current that flows parallel to the shore. The movement of swash and backwash creates a zigzag path of water molecules that transports sediments along the shallow bottom in the same direction as the longshore drift. Much of the transport of sand along many beaches results from longshore currents. Longshore currents are prime determiners of the shape and extent of sandbars and other depositional shoreline features. At the same time, because of their ability to erode loose sand, longshore currents may remove large amounts of sand from a beach. Longshore drift and longshore currents, working together, are potent agents of sand transport on beaches and in very shallow waters. In slightly deeper waters (less than 50 m), longshore currents—especially those running during intense storms—strongly affect the bottom.
Some types of flows related to longshore currents can pose a threat to unwary swimmers. A rip current, for example, is a strong flow of water moving seaward at right angles to the shore (see Figure 20.3d). It occurs when a longshore current builds up along the shore and the water piles up imperceptibly until a critical point is reached. At that point, the water breaks out to sea, flowing through the oncoming waves in a fast current. Swimmers can avoid being carried out to sea by swimming parallel to the shore to get out of the rip.
Tides
For thousands of years, mariners and coastal dwellers have observed the twice-daily rise and fall of the ocean that we call tides. Many observers noticed a relationship between the position and phases of the Moon, the heights of the tides, and the times of day at which the water reaches high tide. Not until the seventeenth century, however, when Isaac Newton formulated the laws of gravitation, did we begin to understand that tides result from the gravitational pull of the Moon and the Sun on the water of the oceans.
The gravitational attraction between any two bodies decreases as they get farther apart. Thus, the strength of this attraction varies across Earth’s surface. On the side of Earth closest to the Moon, the ocean water experiences a greater gravitational attraction than the average for the whole of the solid Earth. This pull produces a bulge in the water. On the side of Earth farthest from the Moon, the solid Earth, being closer to the Moon than the water, is pulled toward the Moon more than the water is, and the water therefore appears to be pulled away from Earth as another bulge. Thus, two bulges of water are formed in Earth’s oceans: one on the side nearest the Moon, and the other on the side farthest from the Moon (Figure 20.4a). As Earth rotates, these bulges of water stay approximately aligned: one always faces the Moon, and the other is always directly opposite the Moon. These bulges of water passing over the rotating Earth are the high tides.
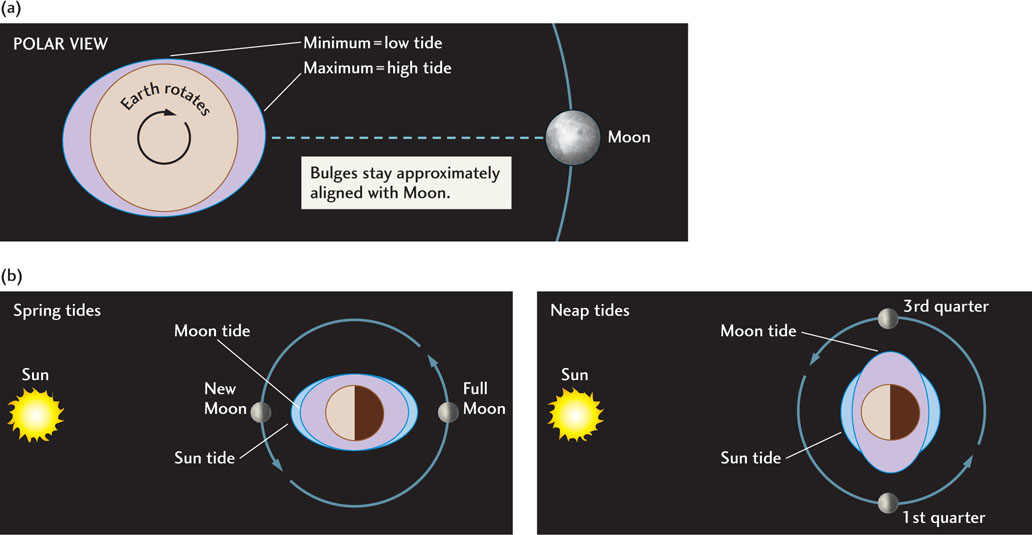
The Sun, although much farther away, has so much mass (and thus so much gravitational force) that it, too, causes tides. Sun tides are a little less than half the height of Moon tides, and they are not synchronous with Moon tides. Sun tides occur as Earth rotates once every 24 hours, the length of a solar day. The rotation of Earth with respect to the Moon is a little longer because the Moon is moving around Earth, resulting in a lunar day of 24 hours and 50 minutes. In that lunar day, there are two high tides, with two low tides between them.
When the Moon, Earth, and Sun line up, the gravitational forces of the Sun and the Moon reinforce each other. This alignment produces the spring tides, which are the highest tides; their name is not related to the season, but to the German verb springen, meaning “to leap up.” They appear every 2 weeks, at the full and new Moon. The lowest tides, the neap tides, come in between, at the first- and third-quarter Moon, when the Sun and Moon are at right angles to each other with respect to Earth (Figure 20.4b).
Although tides occur regularly everywhere, the difference between high and low tides varies in different parts of the ocean. As Earth rotates, the tidal bulges of water move along the surface of the ocean, encountering obstacles, such as continents and islands, which hinder the flow of the water. In the middle of the Pacific Ocean—in the Hawaiian Islands, for example, where there is little to obstruct the flow of the tides—the difference between low and high tides is only 0.5 m. Near Seattle, where the shape of the shoreline along Puget Sound is very irregular and the tidal flow must move through narrow passageways, the difference between low and high tides is about 3 m. Extraordinary tides occur in a few places, such as the Bay of Fundy in eastern Canada, where the tidal range can be more than 12 m. Many coastal residents need to know when tides will occur, so governments publish tide tables showing predicted tide heights and times. These tables combine local knowledge of water flow patterns with knowledge of the astronomical movements of Earth and the Moon with respect to the Sun.
557
Tides moving near shorelines cause currents that can reach speeds of a few kilometers per hour. As the tide rises, water flows in toward the shore as a flood tide, moving through narrow passages into inlets and bays, into shallow coastal wetlands, and up small streams. As the tide passes the high stage and starts to fall, the water flows out as an ebb tide, and low-lying coastal areas are exposed. Tidal currents meander across tidal flats, muddy or sandy areas that are exposed at low tide but flooded at high tide (Figure 20.5). Where obstacles restrict tidal flow and increase tidal range, current velocities may become very high. Large sand ridges many meters high may be formed in these tidal channels.
Hurricanes and Coastal Storm Surges
Hurricanes are the greatest storms on Earth, swirling masses of dense clouds hundreds of kilometers across that suck their energy from the warm surface waters of tropical oceans. The term hurricane originates from the name Huracan, a god of storms to the Mayan people of Central America. In the western Pacific and China Sea, hurricanes are known as typhoons, from the Cantonese word tai-fung, meaning “great wind.” In Australia, Bangladesh, Pakistan, and India, they are known as cyclones; in the Philippines, they are called baguios.
558
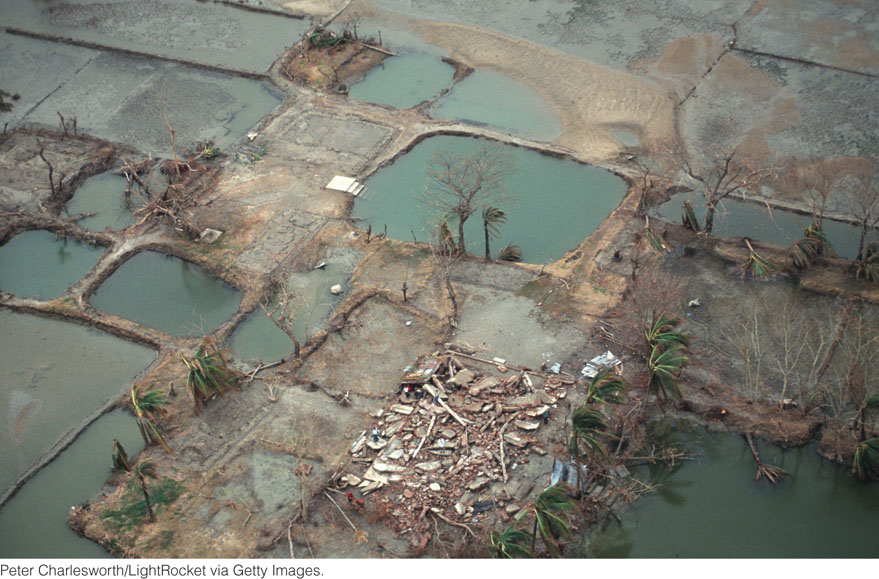
Whatever you call them, these intense tropical storms can wreak havoc. For example, a catastrophic cyclone struck the coastal lowlands of Bangladesh in 1970, drowning as many as 500,000 people—perhaps the deadliest natural disaster of modern times. Another cyclone hit the same region in 1991, drowning at least 140,000 (Figure 20.6). The 1991 storm was more intense, but its death toll was lower due to better disaster preparations; 2 million people were evacuated.
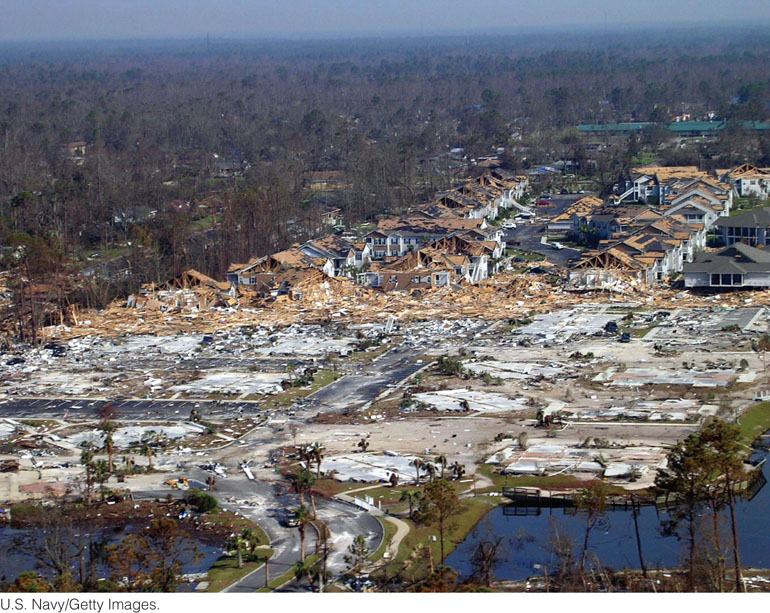
The damaging effects of a hurricane’s extremely high, sustained winds and torrential rains are intuitively easy to understand. However, the associated storm surge, which may flood major regions of the coastline, is potentially the most destructive effect of a hurricane. When Hurricane Katrina struck New Orleans, Louisiana, on August 29, 2005, the disaster that followed was not so much the result of the direct impact of the hurricane itself as of the storm surge, which ultimately caused several sections of the artificial levee system protecting New Orleans to collapse (see Earth Policy 20.1). Subsequent flooding of parts of the city claimed hundreds of lives and left the city submerged and abandoned for almost a month. Hurricane Sandy was the second costliest hurricane in United States history (second to Hurricane Katrina) and hit the east coast of the United States in late October 2012. While Sandy caused water levels to rise along the entire east coast, it caused a catastrophic storm surge along the New Jersey, New York, and Connecticut coastlines.
Hurricane Formation
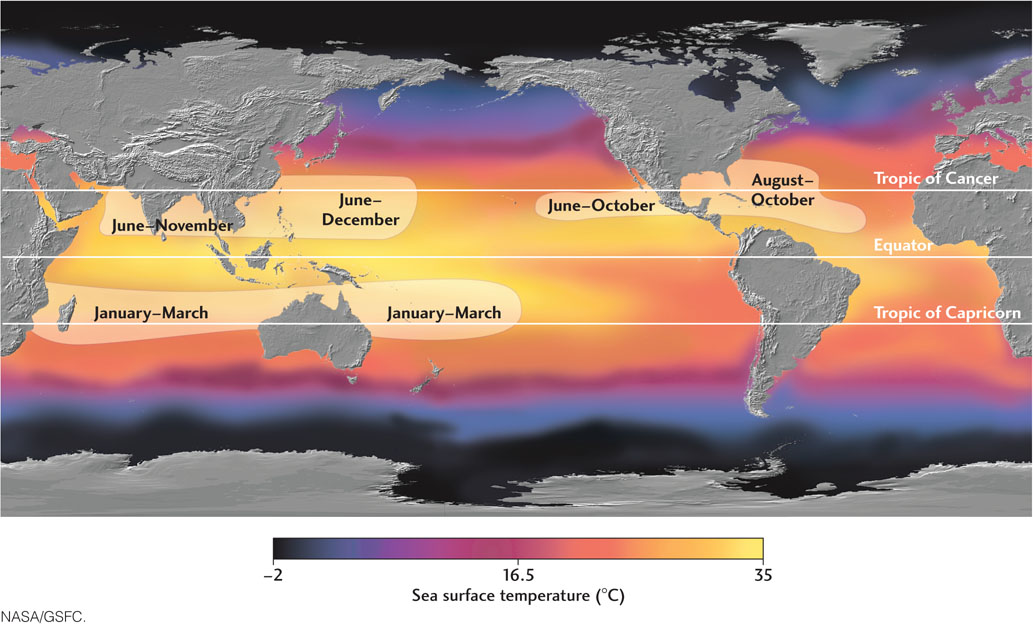
Hurricanes form over tropical parts of Earth’s oceans, between 88 and 208 latitude, in areas of high humidity, light winds, and warm sea surface temperatures (typically 26°C or greater). These conditions usually occur in the summer and early fall in the tropical North Atlantic and North Pacific. For this reason, hurricane “season” in the Northern Hemisphere runs from June through November (Figure 20.7).
The first sign of hurricane development is the appearance of a cluster of thunderstorms over the tropical ocean in a region where the trade winds converge. Occasionally, one of these clusters breaks out from this convergence zone and becomes better organized. Most hurricanes that affect the Atlantic Ocean and Gulf of Mexico originate in a convergence zone just off the coast of West Africa and intensify as they break out and move westward across the tropical Atlantic.
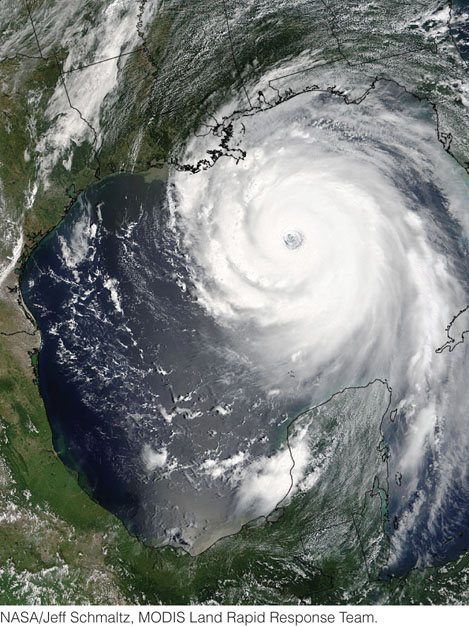
As the hurricane develops, water vapor condenses to form rain, which releases heat energy. In response to this atmospheric heating, the surrounding air becomes less dense and begins to rise, and the atmospheric pressure at sea level drops in the region of heating. As the warm air rises, it triggers more condensation and rainfall, which in turn releases more heat. At this point, a positive feedback process is set in motion, as the rising temperatures in the center of the storm cause surface pressures to fall to progressively lower levels. In the Northern Hemisphere, because of the Coriolis effect (see Chapter 19), the increasing winds begin to circulate in a counterclockwise pattern around the storm’s area of lowest pressure, which ultimately becomes the “eye” of the hurricane (Figure 20.8).
559
Once sustained wind speeds reach 37 km/hour (23 miles/hour), the storm system is called a tropical depression. As winds increase to 63 km/hour (39 miles/hour), the system is called a tropical storm and receives a name. This naming tradition started with the use of World War II code names, such as Andrew, Bonnie, Charlie, and so forth. Finally, when wind speeds reach 119 km/hour (74 miles/hour), the storm is classified as a hurricane. Once it becomes a hurricane, the storm is assigned a 1–5 rating based on the Saffir-Simpson hurricane intensity scale (Table 20.1). This scale is used to estimate the potential property damage and flooding expected along the coast from hurricane landfall. It is analogous to the Mercalli intensity scale for earthquakes (see Table 13.1).
560
| Storm Classification | Description |
|---|---|
| Category 1 | Winds 119–153 km/hour (74–95 miles/hour). Storm surge generally 1–1.5 m (4–5 feet) above normal. No real damage to building structures. Damage primarily to unanchored mobile homes, shrubbery, and trees. Some damage to poorly constructed signs. Some coastal road flooding and minor pier damage. |
| Category 2 | Winds 154–177 km/hour (96–110 miles/hour). Storm surge generally 2–2.5 m (6–8 feet) above normal. Some roofing material, door, and window damage to buildings. Considerable damage to shrubbery and trees, with some trees blown down. Considerable damage to mobile homes, poorly constructed signs, and piers. Coastal and low-lying escape routes flood 2–4 hours before arrival of the hurricane center. Small craft in unprotected anchorages break moorings. Hurricane Frances of 2004 made landfall over the southern end of Hutchinson Island, Florida, as a Category 2 hurricane. |
| Category 3 | Winds 178–209 km/hour (111–130 miles/hour). Storm surge generally 2.5–3.5 m (9–12 feet) above normal. Some structural damage to small residences and utility buildings with a minor amount of curtain-wall failure. Damage to shrubbery and trees with foliage blown off trees and large trees blown down. Mobile homes and poorly constructed signs are destroyed. Low-lying escape routes are cut off by rising water 3–5 hours before arrival of the hurricane center. Flooding near the coast destroys smaller structures, with larger structures damaged by battering from floating debris. Terrain continuously lower than 1.5 m (5 feet) above sea level may be flooded 3 m (10 feet) inland or more. Evacuation of low-lying residences within several blocks of the shoreline may be required. Hurricanes Jeanne and Ivan of 2004 were Category 3 hurricanes when they made landfall in Florida and Alabama, respectively. Hurricane Katrina of 2005 made landfall near Buras-Triumph, Louisiana, with winds of 204 km/hour (127 miles/hour). Katrina will prove to be the costliest hurricane on record, with estimates of more than $200 billion in losses. |
| Category 4 | Winds 210–250 km/hour (131–155 miles/hour). Storm surge generally 3.5–5 m (13–18 feet) above normal. More extensive curtain-wall failures with some complete roof structure failures on small residences. Shrubs, trees, and all signs are blown down. Complete destruction of mobile homes. Extensive damage to doors and windows. Low-lying escape routes may be cut off by rising water 3–5 hours before arrival of the hurricane center. Major damage to lower floors of structures near the shore. Terrain lower than 3 m (10 feet) above sea level may be flooded, requiring massive evacuation of residential areas as far inland as 15 km (9 miles). |
| Category 5 | Winds greater than 250 km/hour (155 miles/hour). Storm surge generally greater than 5 m (18 feet) above normal. Complete roof failure on many residences and industrial buildings. Some complete building failures with small utility buildings blown over or away. All shrubs, trees, and signs blown down. Complete destruction of mobile homes. Severe and extensive window and door damage. Low-lying escape routes are cut off by rising water 3–5 hours before arrival of the hurricane center. Major damage to lower floors of all structures located less than 4.5 m (15 feet) above sea level and within 500 m (1650 feet) of the shoreline. Massive evacuation of residential areas on low ground within 15–20 km (9–12 miles) of the shoreline may be required. Only three Category 5 hurricanes have made landfall in the United States since records began. Hurricane Andrew of 1992 made landfall over southern Miami-Dade County, Florida, causing $26.5 billion in losses—the second costliest hurricane on record. |
561
Storm Surges
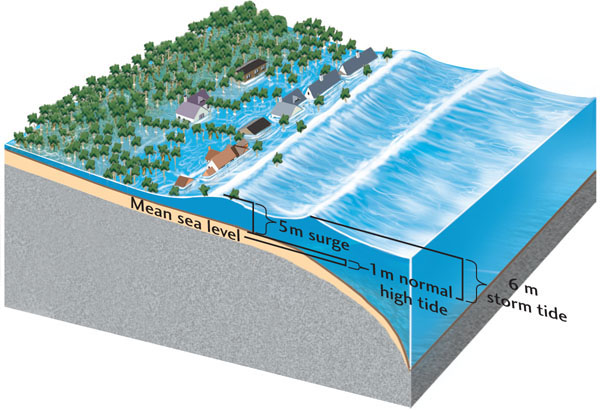
As a hurricane intensifies, a dome of seawater—known as a storm surge—rises above the level of the surrounding ocean surface. The height of the storm surge is directly related to the atmospheric pressure in the eye of the hurricane and the strength of the winds that encircle it. Large swells, high surf, and wind-driven waves ride atop the surge. As the hurricane nears land, the surge moves ashore and floods coastal land areas, causing extensive damage to structures and the shoreline environment (Figure 20.9). Any landmass in the path of a storm surge will be affected to a greater or lesser extent, depending on a number of factors. The stronger the storm and the shallower the offshore waters, the higher the storm surge. When the effects of a storm surge coincide with a normal high tide, the result is known as a storm tide (Figure 20.10).
562
The storm surge is the deadliest of a hurricane’s associated hazards, as underscored by Hurricane Katrina in 2005 and Hurricane Sandy in 2012. The magnitude of a hurricane is usually described in terms of its wind speed (see Table 20.1), but coastal flooding causes many more deaths than high wind. Boats ripped from their moorings, utility poles, and other debris floating atop a storm surge often demolish those buildings that are not destroyed by the winds. Even without the weight of floating debris, a storm surge can severely erode beaches and highways and undermine bridges. Because much of the United States’ densely populated Atlantic and Gulf Coast shorelines lie less than 3 m above sea level, the danger from storm surges there is tremendous.
Hurricane Sandy was the second costliest hurricane in United States history, estimated at over $68 billion (second to Hurricane Katrina) and hit the east coast of the United States in late October 2012. As the storm formed, it affected much of the Caribbean, including Jamaica, Haiti, Dominican Republic, Puerto Rico, Cuba, and the Bahamas, then worked its way up the eastern coastline of the United States, affecting 24 states. The storm made landfall near Brigantine, New Jersey, and while Sandy caused water levels to rise along the entire east coast, it caused catastrophic storm surge along the New Jersey, New York, and Connecticut shorelines. The surge flooded streets, tunnels, and subway lines and cut power to much of the region. The path was correctly predicted nearly 8 days before it hit the eastern seaboard, so preparations were underway days before. Subway entrances and grates were covered in New York City, although flooding still occurred. There were mandatory evacuations, schools were closed, mass transit was shut down, airports were closed, and bus and rail services were suspended. Despite the preparation, communities were flooded with water and sand, houses were washed from their foundations, the New Jersey boardwalk and pier was destroyed, and cars and boats were tossed about. The storm also caused devastating fires in New York. Trees fell on power lines, transformers exploded, and wires fell into water, creating a dangerous fire that was hard to access and fight due to flooded communities.
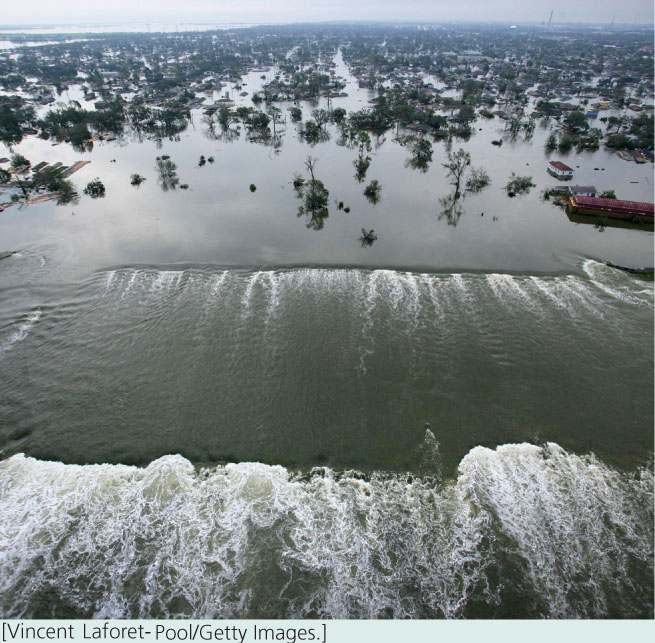
Earth Policy: 20.1 The Great New Orleans Flood
On August 25, 2005, Hurricane Katrina struck southern Florida as a Category 1 storm, killing 11 people. Three days later, in the Gulf of Mexico, the hurricane grew to a monster Category 5 storm, with maximum sustained winds of up to 280 km/hour (175 miles/hour) and gusts up to 360 km/hour (225 miles/hour). On August 28, the National Weather Service issued a bulletin predicting “devastating” damage to the Gulf Coast, and the mayor of New Orleans ordered an unprecedented mandatory evacuation of the city.
When Katrina made landfall just south of New Orleans on August 29, it was a nearly Category 4 storm, with sustained winds of 204 km/hour (127 miles/hour). It had a minimum atmospheric pressure of 918 millibars (27.108 inches), making it the third strongest hurricane on record to make landfall in the United States. More than 100 people lost their lives during the early morning hours of August 29 as a result of the direct impact of the storm.
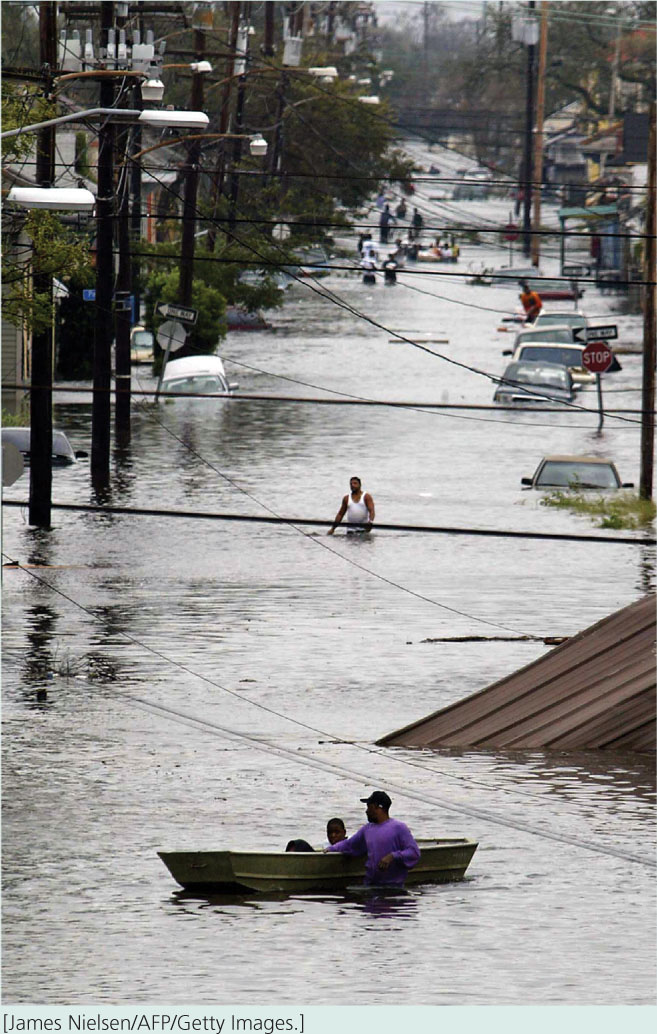
A 5- to 9-m storm surge came ashore over virtually the entire coastline of Louisiana, Mississippi, Alabama, and the Florida panhandle. The 9-m storm surge at Biloxi, Mississippi, was the highest ever recorded in the United States. The effects of this storm surge on New Orleans were devastating and unprecedented. Lake Pontchartrain, which is really a coastal embayment that is easily influenced by ocean conditions, was inundated by the storm surge. By midday on August 29, several sections of the levee system that held back the waters of Lake Pontchartrain from New Orleans had collapsed. Subsequent flooding of the city to depths of up to 7 or 8 m left 80 percent of New Orleans under water. The effects of flooding claimed at least another 300 lives, and by September 21, the death toll exceeded 1500 as disease and malnourishment indirectly caused by the flooding took effect.
Hurricane Katrina has surpassed Hurricane Andrew as the costliest natural disaster in U.S. history, with damages reaching almost $200 billion. In addition to the thousands of lives lost, over 150,000 homes were destroyed, and over a million people were displaced—a humanitarian crisis unrivaled in the United States since the Great Depression.
563
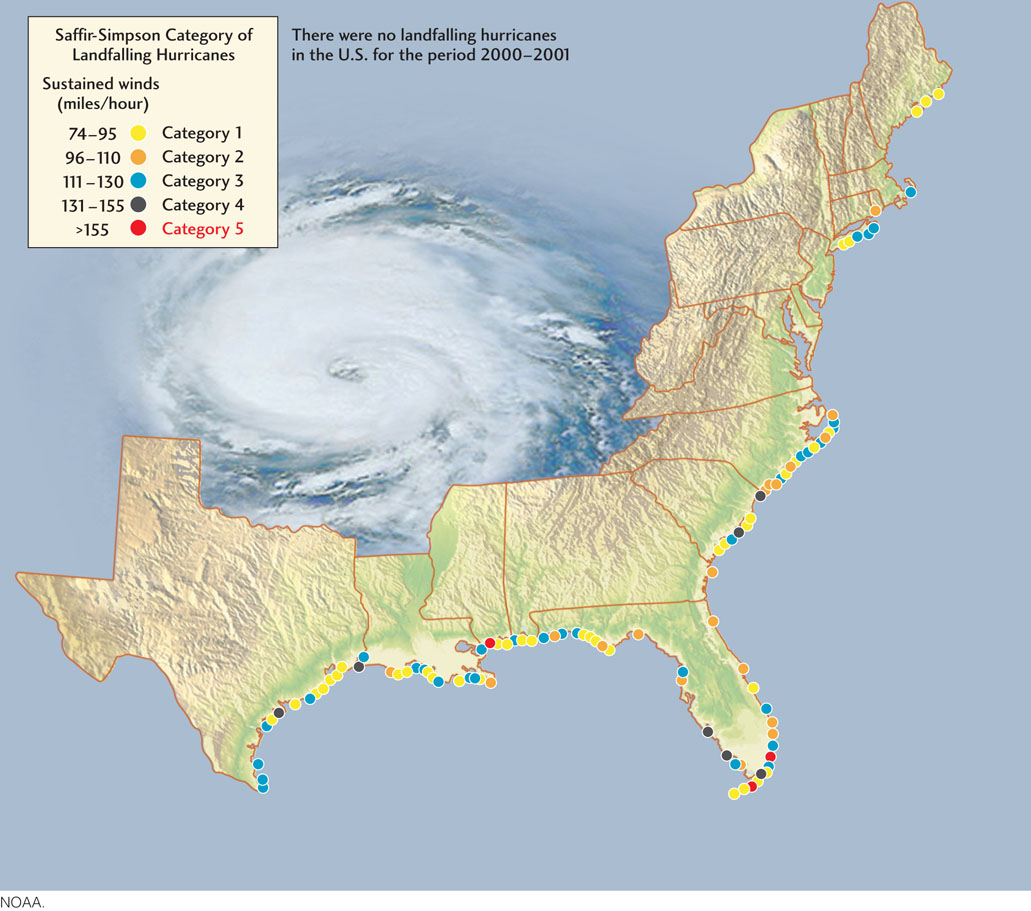
What happened, and what could have been done to limit the damage? As with most natural disasters, the outcome was a result of rare but powerful geologic forces coupled with a lack of human preparation. No one had anticipated and planned for the worst-case scenario. Earth scientists had predicted for decades that a Category 4 or 5 hurricane would strike New Orleans eventually. The historical record of hurricanes made it clear that such an event was almost certain to happen. As Figure 20.11 shows, New Orleans is about in the middle of the “catcher’s mitt” for hurricane landfalls in the United States. But the city was prepared to resist the damaging effects of only a Category 3 or smaller hurricane. Federal budget cuts had left only token support available to maintain and reinforce the east bank of hurricane levees that held back Lake Pontchartrain. This complex network of concrete walls, metal gates, and giant earthen berms was never completed, leaving the city vulnerable. Furthermore, it is not easy to protect a city from hurricane storm surges when its sidewalks and houses are, on average, 4 m below sea level. New Orleans is equally vulnerable to unusually large floods of the Mississippi River, which is also held back by an artificial levee system.
When large catastrophic events are rare, it is natural to question whether they are worth worrying about, and human memory may fail to provide the necessary guidance. Over the short term, we may escape these threats by random good luck. But over the long term, recorded history and the geologic record show that these rare and devastating forces will eventually take their toll if we are not adequately prepared.
Hurricane Landfall
Because hurricanes form over and move across tropical waters, most make landfall at low latitudes. Most North Atlantic hurricanes make landfall in Florida and the northern Gulf of Mexico (Figure 20.11). However, because there is a tendency for winds to be deflected northward (due to the Coriolis effect), hurricanes sometimes make landfall farther up the Atlantic coast. In rare cases, they may reach New England, but are always of lower intensity there because of the lower ocean surface temperatures. The most powerful Category 4 and 5 hurricanes are restricted to lower latitudes.
The tropical storms that grow into hurricanes can be tracked by satellites, and weather conditions inside the storms can be probed by airplanes. By feeding many types of data into computer models, meteorologists can predict a storm’s track and changes in its intensity up to several days in advance of landfall with reasonable accuracy. The National Hurricane Center accurately predicted that Katrina would hit New Orleans as a severe hurricane 3 days before it actually did.
564