Recent Advances in Timing the Earth System
We have seen that the time scales of geologic processes are not uniform, but vary from seconds to billions of years. We must therefore use a variety of methods for timing the Earth system: some to determine the ages of very old rocks, others to measure rapid changes. New methods for determining the relative and absolute ages of Earth materials have steadily improved our understanding of how the Earth system works. To conclude our story of the geologic time scale, we will describe a few of these recent advances.
Sequence Stratigraphy
Until a few decades ago, geologists had to rely on rocks exposed at outcrops, in mines, and by drilling to map stratigraphic successions. As mentioned in Chapter 1 (and further described in Chapter 14), technological innovations in the field of seismic imaging now allow us to see below Earth’s surface without actually digging holes. From recordings of seismic waves generated by controlled explosions or by natural earthquakes, we can construct three-dimensional images of deeply buried structures (Figure 8.17). Seismic imaging of sedimentary rocks allows geologists to identify sedimentary sequences and map their distribution in three dimensions, a type of geologic mapping called sequence stratigraphy.
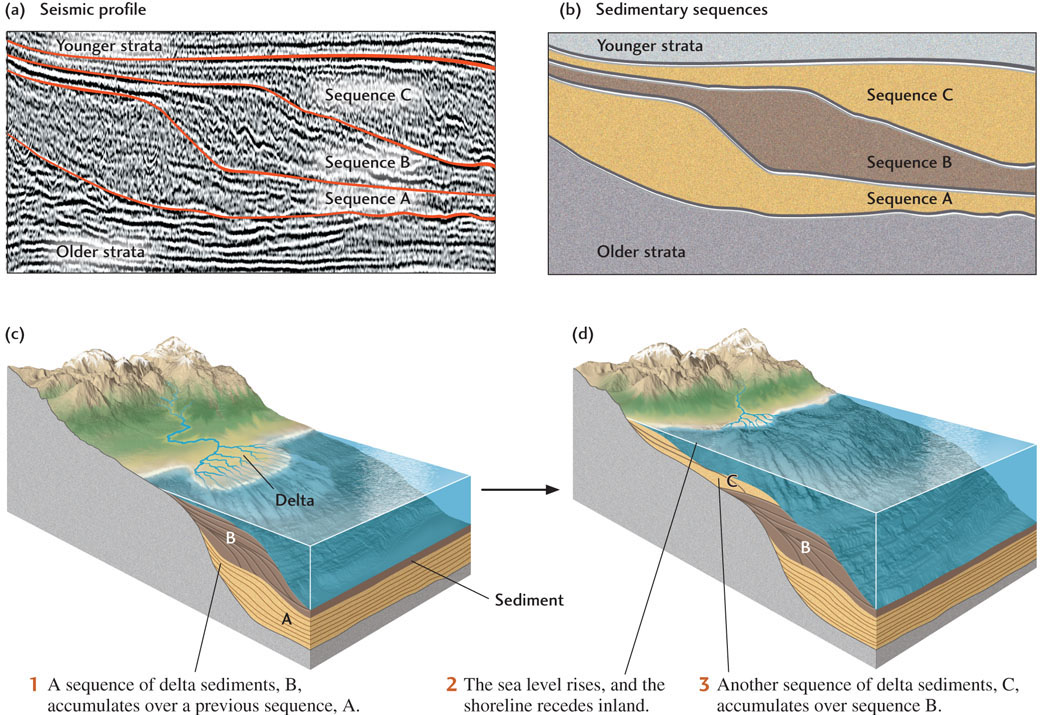
Sedimentary sequences commonly form on the edges of continents; here, sediment deposition by rivers is modified by fluctuations in sea level. In the example shown in Figure 8.17, sediments were laid down in a delta where a river entered the ocean. As the sediments accumulated, the delta advanced seaward. When sea level fell because of continental glaciation, the deltaic deposits were exposed and eroded. Once the glaciers melted and sea level rose, the shoreline shifted inland, and a new deltaic sequence began to cover the old one, creating an unconformity.
Over millions of years, cycles such as this one can be repeated many times, producing a complex set of sedimentary sequences. Because sea level fluctuations are global, geologists can match sedimentary sequences of the same age over large areas. The relative ages of these sequences can then be used to reconstruct the geologic history of a region, including any regional tectonic uplift or subsidence that contributed to sea level changes. Sequence stratigraphy has been especially effective in finding deeply buried oil and gas on continental margins, such as the Gulf of Mexico and the Atlantic margin of North America.
213
Chemical Stratigraphy
Many sedimentary beds contain minerals and chemicals that identify them as distinct units. For example, the amount of iron or manganese in carbonate sediments may vary from bed to bed if the composition of seawater changed during precipitation of the carbonate minerals. When the sediments are buried and transformed into sedimentary rocks, these chemical variations may be preserved, “fingerprinting” the formations. These chemical fingerprints may extend regionally or even globally, allowing us to match sedimentary rocks by chemical stratigraphy where no other features, such as fossils, are available.
Paleomagnetic Stratigraphy
Another technique for fingerprinting rock formations is paleomagnetic stratigraphy. As we saw in Chapter 1, Earth’s magnetic field reverses itself at irregular intervals. These magnetic reversals are recorded by thermoremanent magnetization in volcanic rocks, which can be dated by isotopic methods. The resulting chronology of magnetic reversals—the magnetic time scale—allows us to “replay the magnetic tape” of seafloor spreading and determine the rates of plate movements, as we saw in Chapter 2. Even more detailed patterns of magnetic reversals can be observed in sediment cores, and these magnetic fingerprints can be dated using faunal successions. Paleomagnetic stratigraphy has recently become one of the main methods for measuring sedimentation rates along the continental margins and in the deep sea. We will discuss paleomagnetic stratigraphy in more detail in Chapter 14.
Clocking the Climate System
The Pliocene and Pleistocene epochs were times of rapid and dramatic global climate change. We can chart these climate changes from the isotopes contained in shelly fossils buried in deep-sea sediments. Deep-sea drilling vessels such as the JOIDES Resolution (see Figure 2.13) have taken cores from sedimentary beds around the world’s oceans. Geologists can use the carbon-14 dating method to estimate when the shells recovered from these sediment cores were formed, and they can measure the stable isotopes of oxygen to estimate temperature of the seawater in which the shell-producing organisms lived.
The carefully tabulation of both temperature and age estimates for many sedimentary layers has provided us with a precise record of global climate during the last 5 million years (Figure 8.18). The record shows a general cooling trend beginning about 3.5 million years ago and the subsequent development of rapid climate cycles that became especially large during the Pleistocene epoch. The low temperatures during these cycles, which were as much as 8° C below the average present-day temperature of Earth’s surface, correspond to the Pleistocene “ice ages,” when glaciers covered large areas of North America, Europe and Asia.
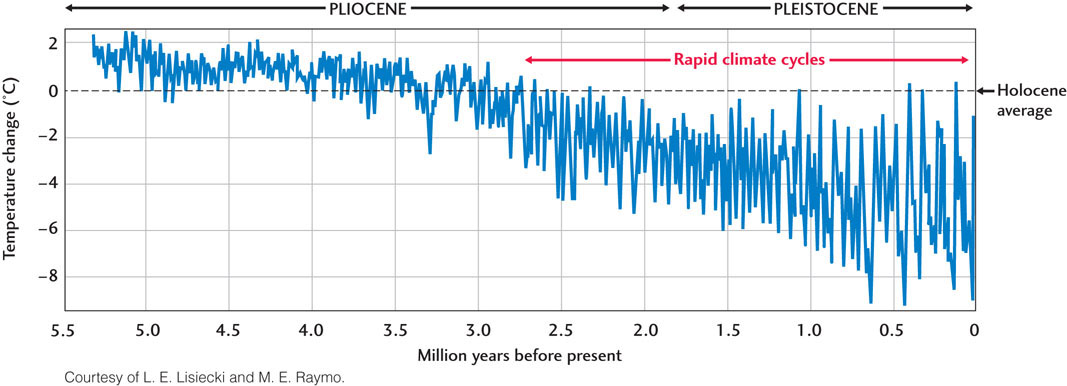
Repeated cycles of glaciation have occurred with dominant periods ranging from 40,000 to 100,000 years. Shorter-term cycles lasting a few thousand years or less are also evident. The effects of these climate cycles, such as rises and drops in sea level, can have profound effects on Earth’s surface. We will explore glacial cycles and their causes in more detail in Chapters 15 and 21.
214