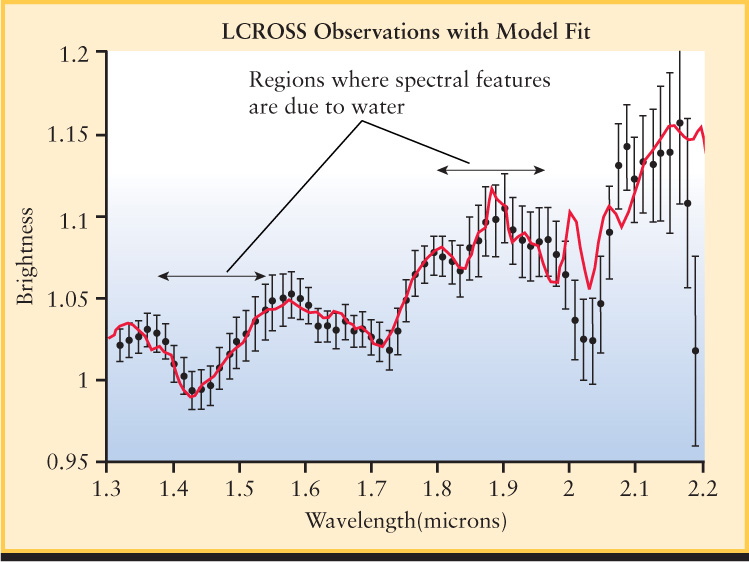
Figure 10-13: Evidence for Lunar Water The infrared spectrum of the plume shown in Figure 10-12 indicates both water vapor and water-ice. The collected data are shown in black with their vertical error bars. The red curve is a model based on the known spectrum of water vapor and ice. There is a very good fit between the model and data in the regions where the spectral features are due to water.