Figure 16-15: RIVUXG
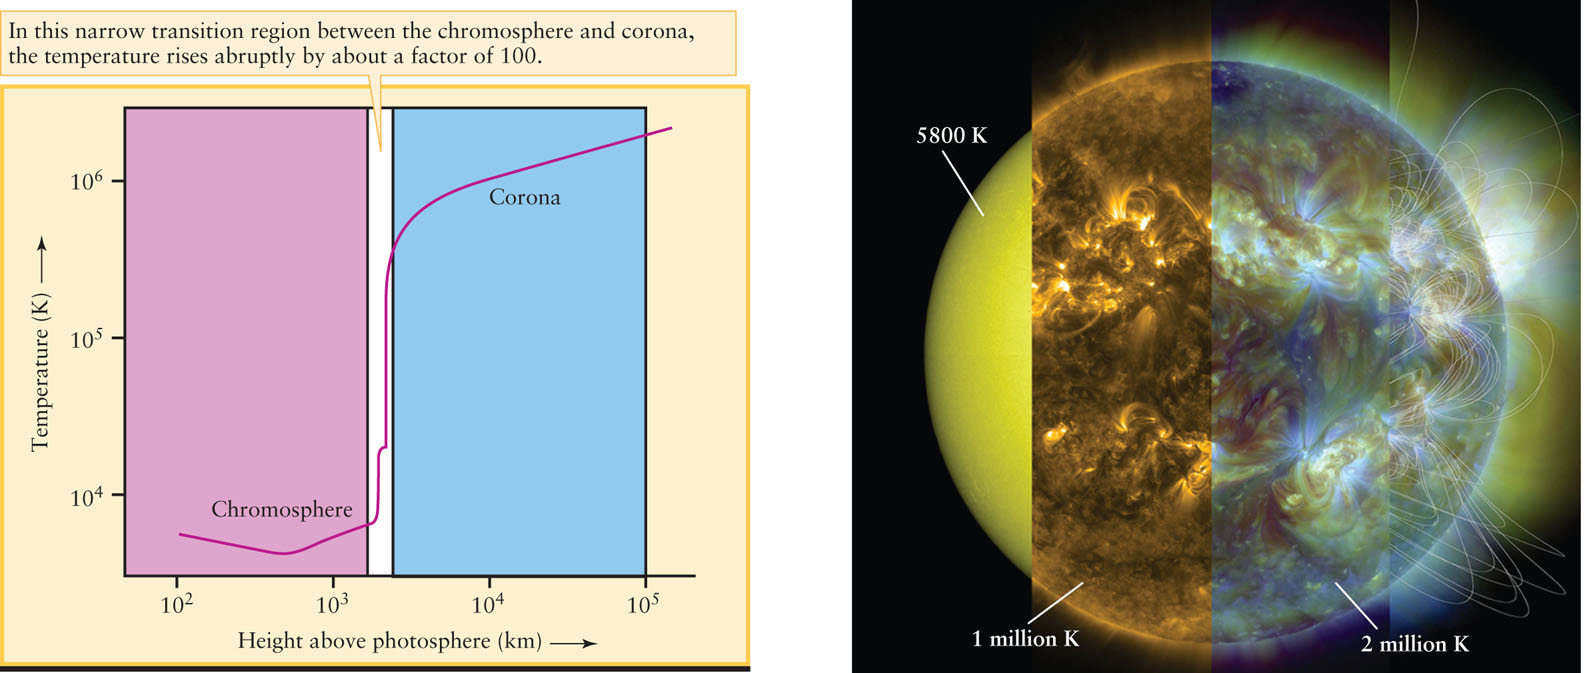
Temperatures in the Sun’s Upper Atmosphere (a) This graph shows how temperature varies with altitude in the Sun’s chromosphere and corona and in the narrow transition region between them. In order to show a large range of values, both the vertical and horizontal scales are nonlinear. (b) This composite portrait shows the different features that appear as wavelengths corresponding to higher temperatures are imaged. At visible wavelengths, the 5800 K photosphere is visible, while ultraviolet light images features at millions of degrees. On the far right, modeling has been used to draw lines of the Sun’s magnetic field in the corona.
Temperatures in the Sun’s Upper Atmosphere (a) This graph shows how temperature varies with altitude in the Sun’s chromosphere and corona and in the narrow transition region between them. In order to show a large range of values, both the vertical and horizontal scales are nonlinear. (b) This composite portrait shows the different features that appear as wavelengths corresponding to higher temperatures are imaged. At visible wavelengths, the 5800 K photosphere is visible, while ultraviolet light images features at millions of degrees. On the far right, modeling has been used to draw lines of the Sun’s magnetic field in the corona.
(a: Adapted from A. Gabriel; b: NASA)