Figure 16-23: R I V U X G
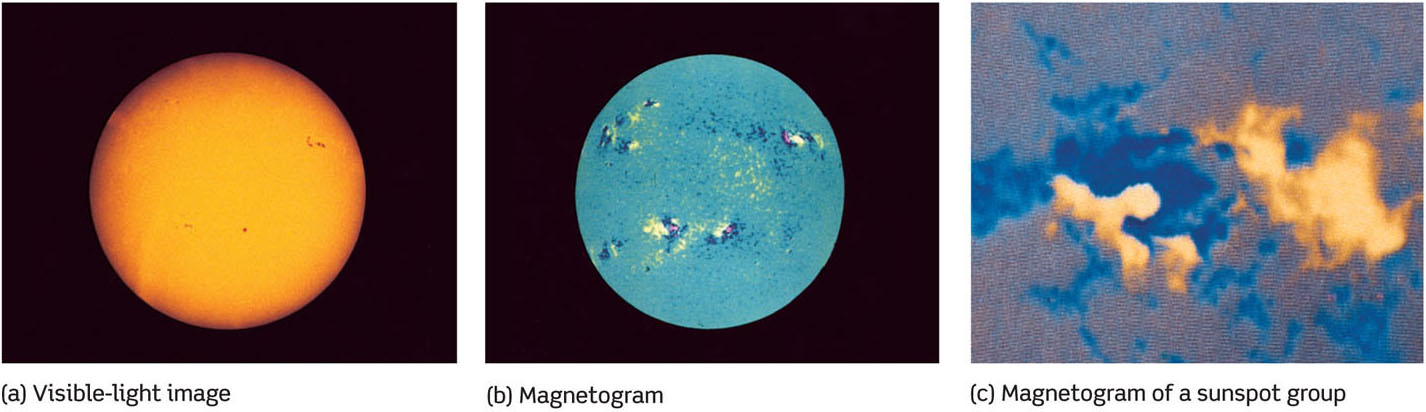
Mapping the Sun’s Magnetic Field (a) This visible-light image and (b) this false-color magnetogram were recorded at the same time. Dark blue and yellow areas in the magnetogram have north and south magnetic polarity, respectively; blue-green regions have weak magnetic fields. The highly magnetized regions in (b) correlate with the sunspots in (a). (c) The two ends of this large sunspot group have opposite magnetic polarities (colored blue and yellow), like the ends of a giant bar magnet.
Mapping the Sun’s Magnetic Field (a) This visible-light image and (b) this false-color magnetogram were recorded at the same time. Dark blue and yellow areas in the magnetogram have north and south magnetic polarity, respectively; blue-green regions have weak magnetic fields. The highly magnetized regions in (b) correlate with the sunspots in (a). (c) The two ends of this large sunspot group have opposite magnetic polarities (colored blue and yellow), like the ends of a giant bar magnet.
(NOAO)