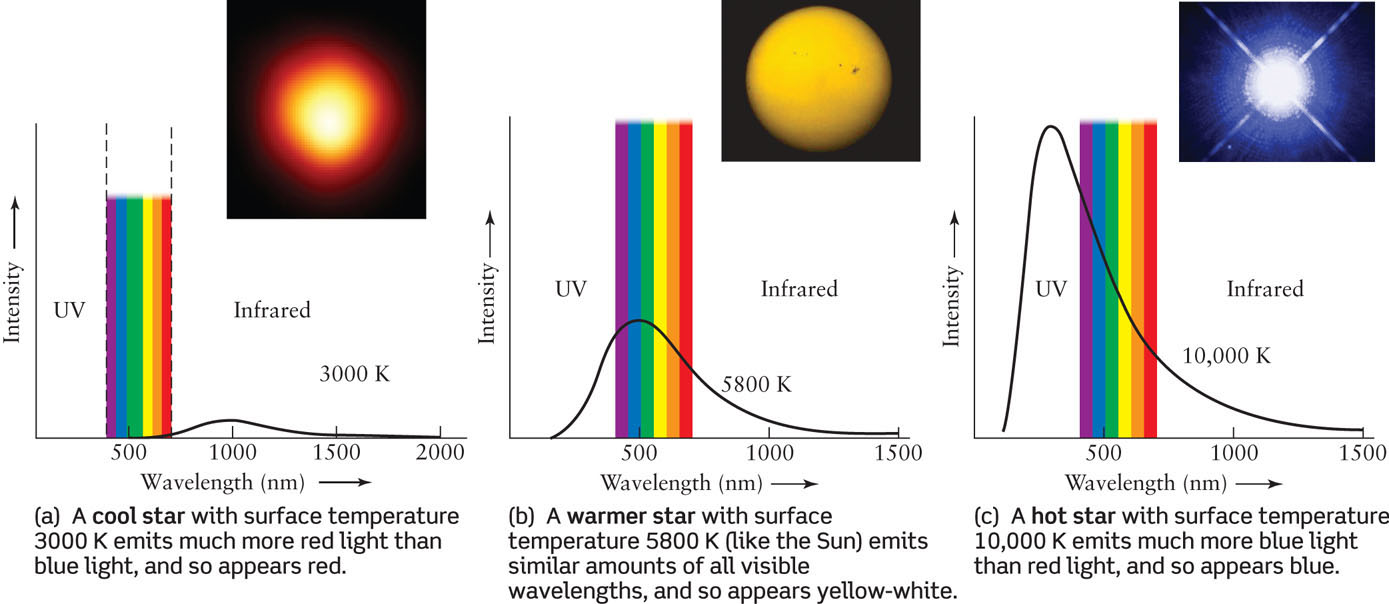
Figure 17-7: Temperature and Color These graphs show the intensity of light emitted by three hypothetical stars plotted against wavelength (compare with Figure 5-11). The rainbow band indicates the range of visible wavelengths. The star’s apparent color depends on whether the intensity curve has larger values at the short-wavelength (blue) or long-wavelength (red) end of the visible spectrum. However, the human brain combines all of the colors in a spectrum, so where the intensity peaks is just one factor shaping the color perceived by the eye. The image insets show stars of about these surface temperatures. UV stands for ultraviolet, which extends from 10 to 400 nm. See Figure 5-12 for more on wavelengths of the spectrum.
(inset a: Andrea Dupree [Harvard-Smithsonian CfA], Ronald Gilliland [STScI, NASA, and ESA]; inset b: NSO/AURA/NSF; inset c: NASA, H. E. Bond, and E. Nelan [STScI]; M. Barstow and M. Burleigh [U. of Leicester, U.K.]; and J. B. Holberg [U. of Arizona])