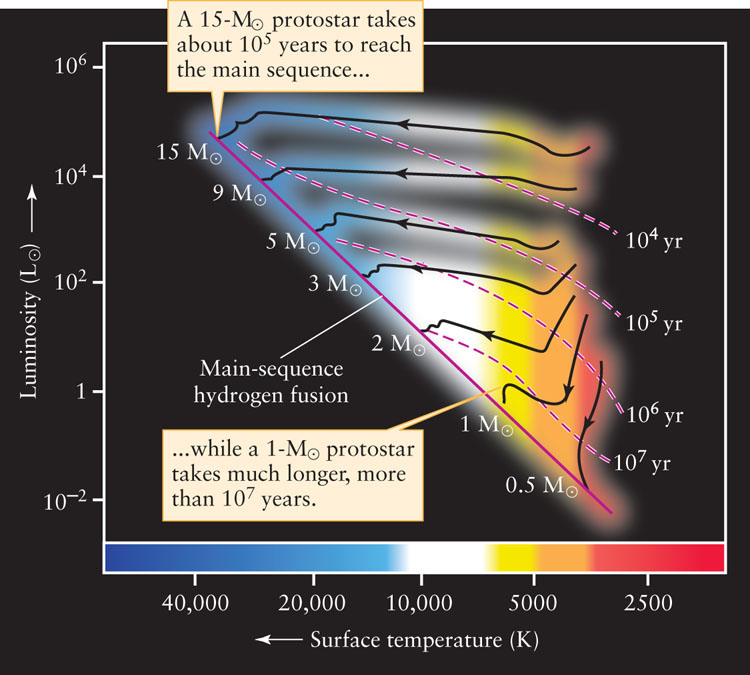
Figure 18-10: Pre–Main-Sequence Evolutionary Tracks on an H-R Diagram As a protostar evolves, its luminosity and surface temperature both change. The tracks shown here depict these changes for protostars of seven different masses. Each dashed red line shows the age of a protostar when its evolutionary track crosses that line. (We will see in Section 18-5 that protostars lose quite a bit of mass as they evolve: The mass shown for each track is the value when the protostar finally settles down as a main-sequence star.)