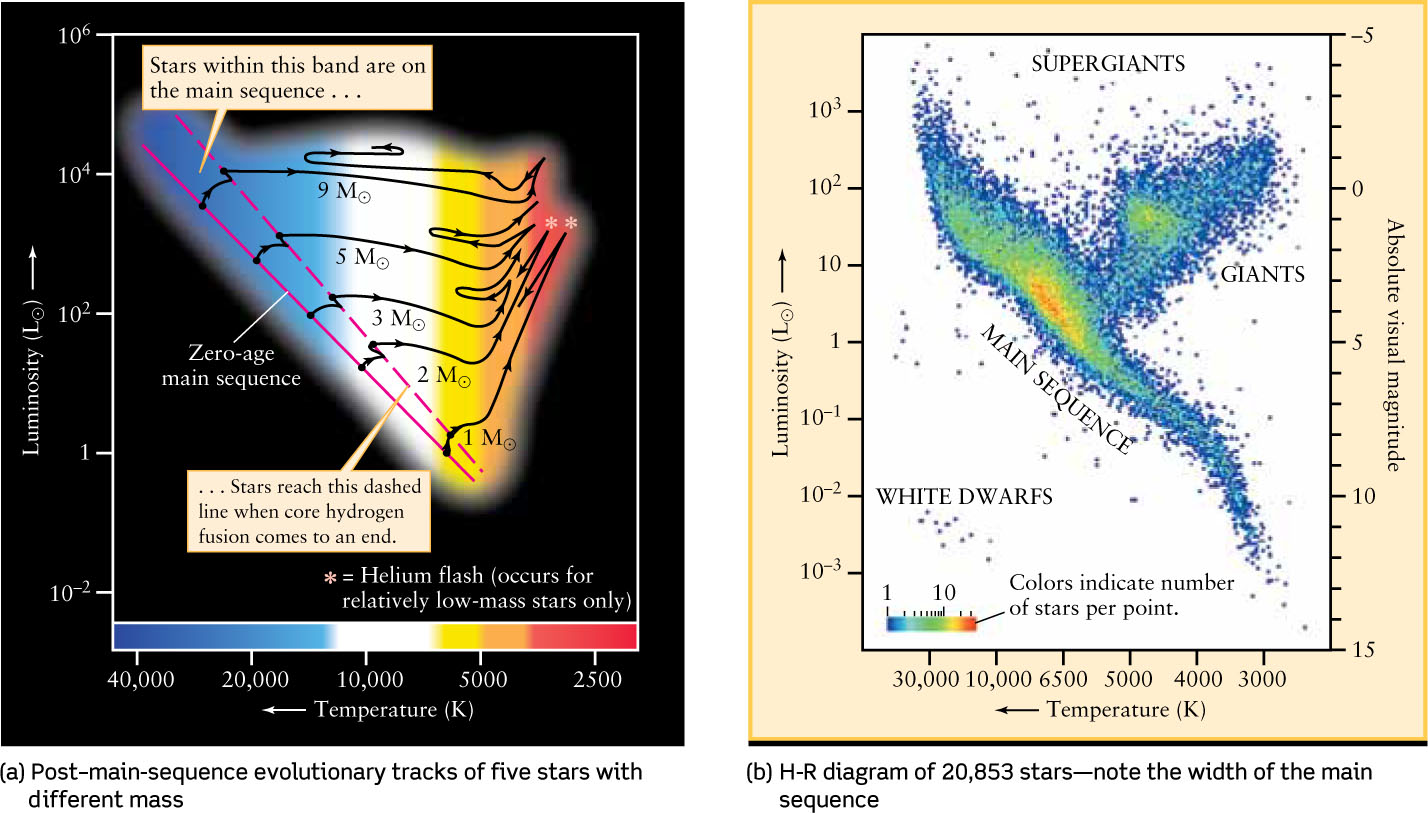
Figure 19-9: H-R Diagrams of Stellar Evolution On and Off the Main Sequence (a) The two lowest-mass stars shown here (1 M⊙ and 2 M⊙) undergo a helium flash at their centers, as shown by the asterisks. In the high-mass stars, core helium fusion ignites more gradually where the evolutionary tracks make a sharp downward turn in the red-giant region on the right hand side of the H-R diagram. (b) Data from the Hipparcos satellite (see Section 17-1) was used to create this H-R diagram. The thickness of the main sequence is due in large part to stars evolving during their main-sequence lifetimes.
(a: Adapted from I. Iben; b: Adapted from M. A. C. Perryman)