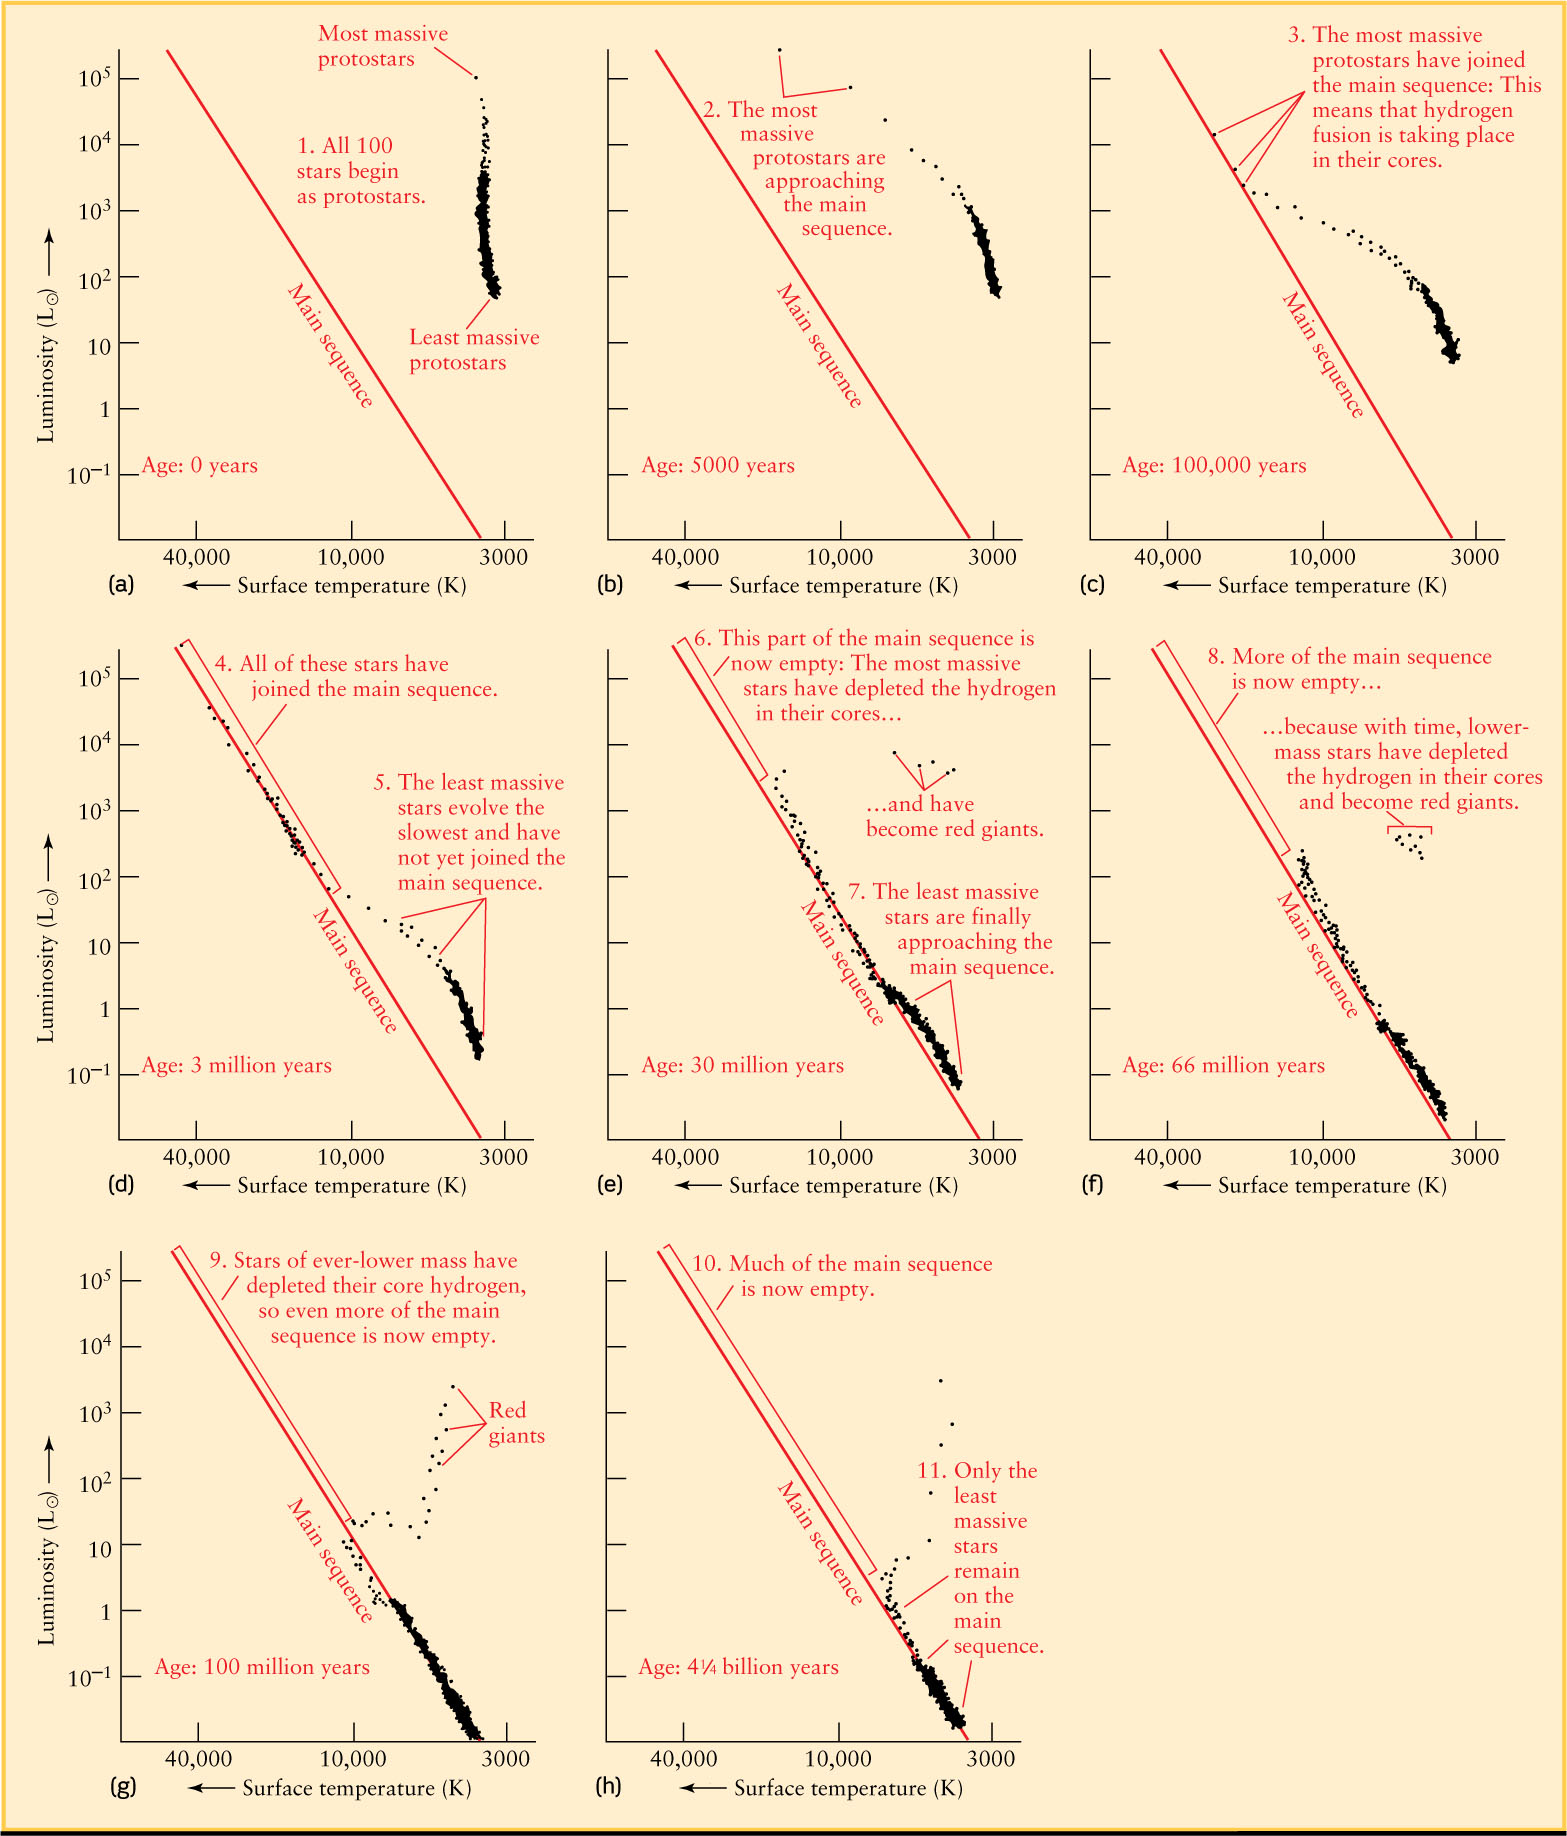
Figure 19-10: The Evolution of a Theoretical Cluster This series of H-R diagrams shows the evolution of 100 stars of different masses in a hypothetical cluster. Each dot represents a star, and “Age” indicates the time that has elapsed since all the stars formed. At each age, the luminosity and surface temperature of each star were calculated using the equations of stellar structure. After a star passes through the red-giant stage, it is deleted from the diagram
(Adapted from R. Kippenhahn)