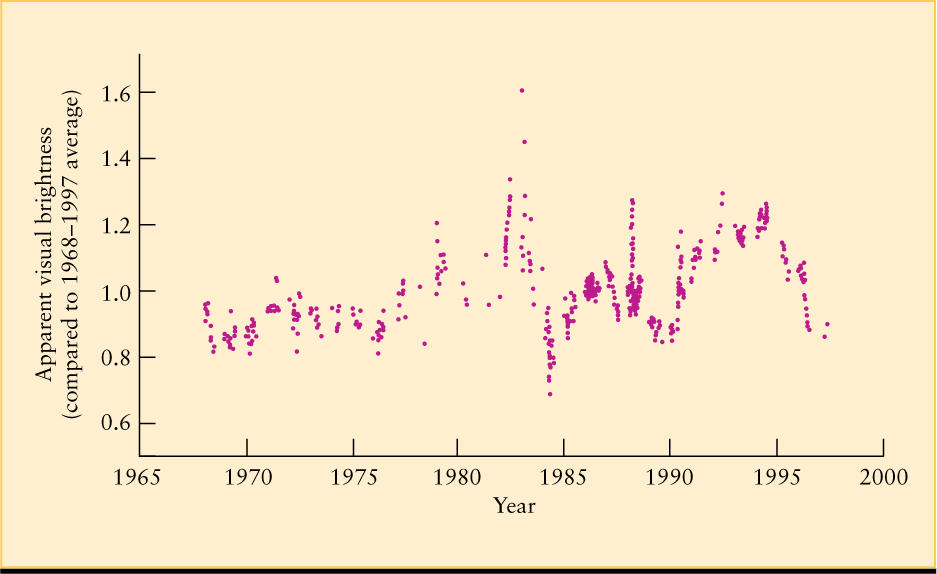
Figure 24-5: Brightness Variations of an AGN This graph shows variations over a 29-year period in the apparent brightness of the quasar 3C 273 (see Figure 24-2a, b). Note the large outburst in 1982–1983 and the somewhat smaller ones in 1988 and 1992.
(Adapted from M. Türler, S. Paltani, and T. J.-L. Courvoisier)