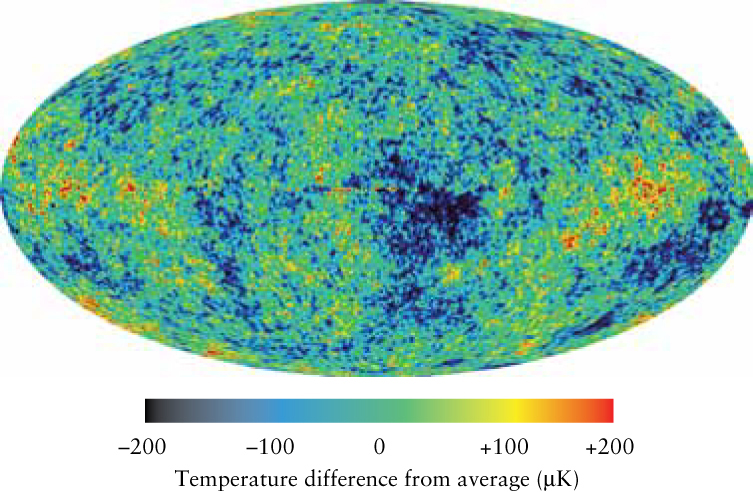
Figure 25-13: R I V U X G
Temperature Variations in the Cosmic Microwave Background This map from WMAP data shows small variations in the temperature of the cosmic background radiation across the entire sky. (The variations due to Earth’s motions through space, shown in Figure 25-8, have been factored out.) Lower-temperature regions (shown in blue) show where the early universe was slightly denser than average; warmer regions (shown in red) correspond to regions where the density of matter was less dense than average. Note that the temperature variations in this figure are no more than 200 μK, or 2 × 10⁻⁴ K; these are tiny fluctuations around the blackbody radiation measured by COBE in Figure 25-7.
(NASA/WMAP Science Team)