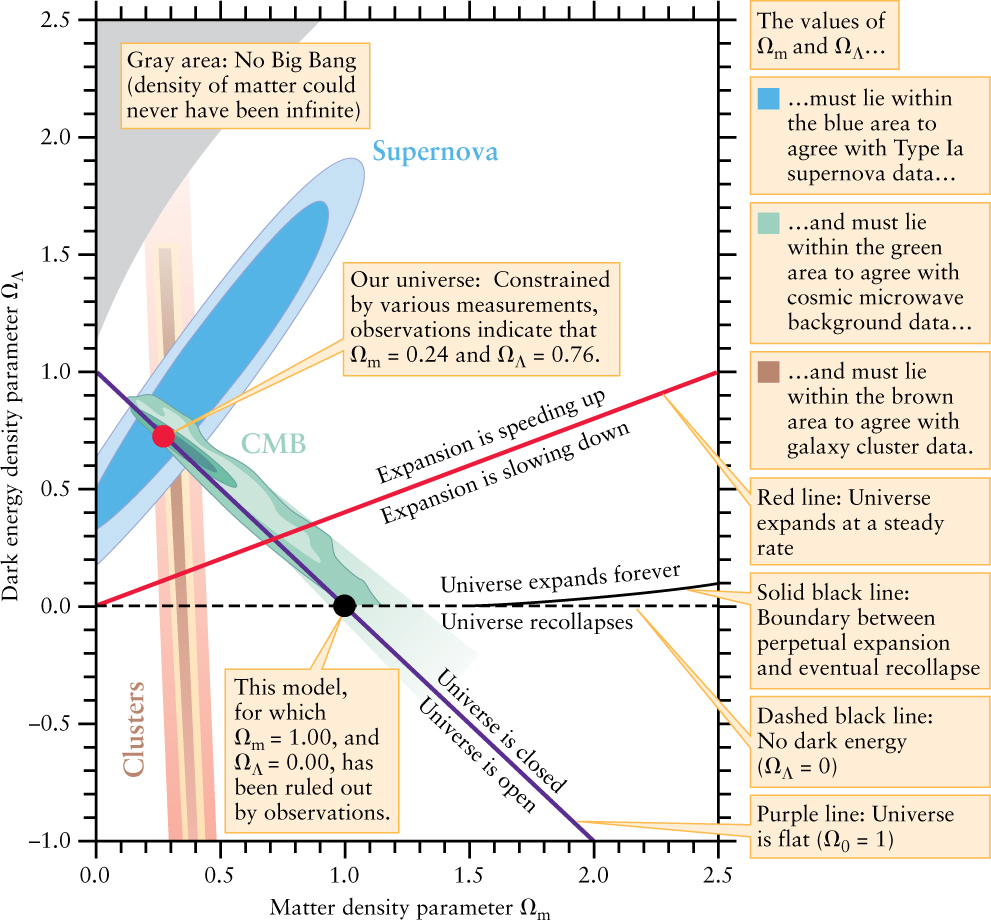
Figure 25-18: Limits on the Nature of the Universe The three regions on this graph show values of the mass density parameter Ωm and the dark energy density parameter ΩΛ that are consistent with various types of observations. Galaxy cluster measurements (in brown) set limits on Ωm. Observations of the cosmic microwave background (in green) set limits on the sum of Ωm and ΩΛ: A larger value of Ωm (to the right in the graph) implies a smaller value of ΩΛ (downward in the graph) to keep the sum the same, which is why this band slopes downward. Observations of Type Ia supernovae (in blue) set limits on the difference between Ωm and ΩΛ; this band slopes upward since a larger value of Ωm implies a larger value of ΩΛ to keep the difference the same. The best agreement to all these observations is where all three regions overlap (the red dot).
(The Supernova Cosmology Project/S. Perlmutter)