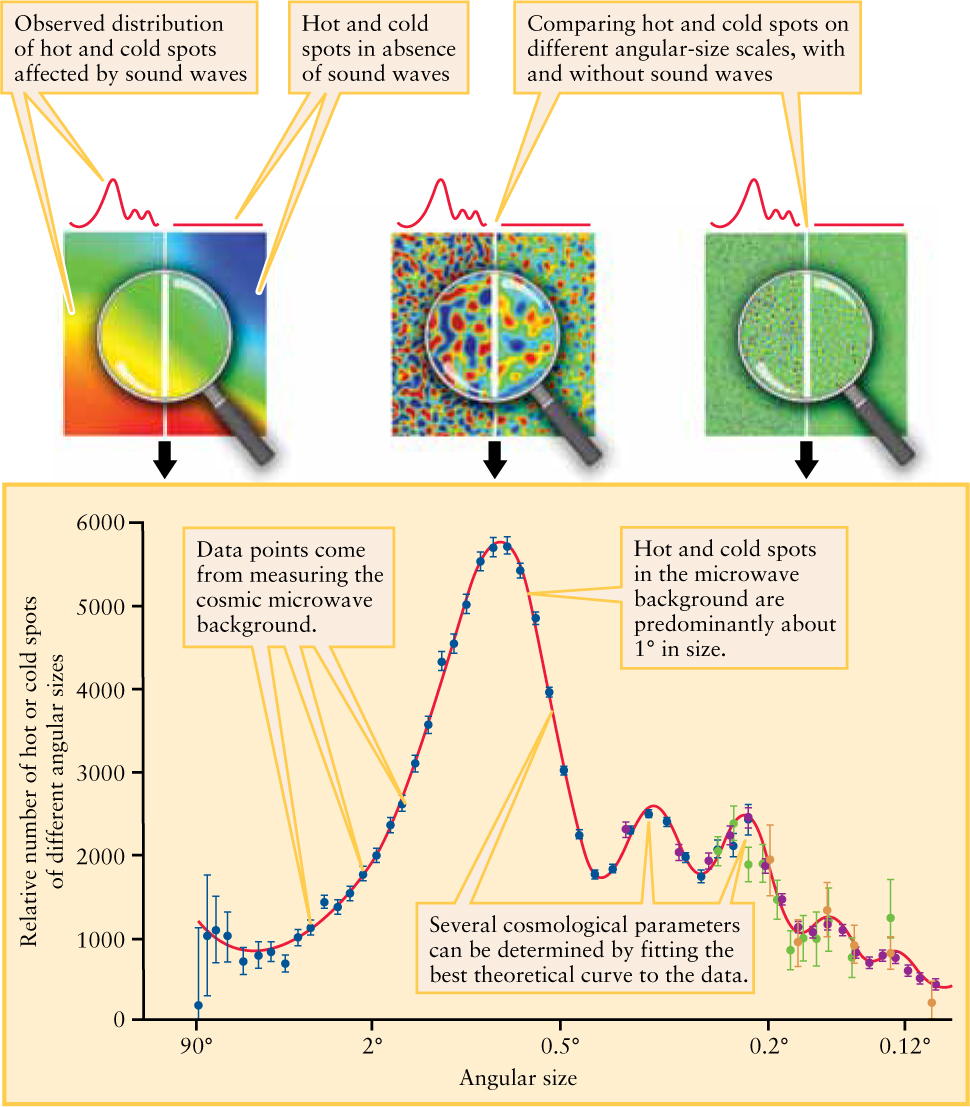
Figure 25-21: Sound Waves in the Early Universe Top panel: At three different angular sizes (90°, 1°, and 0.25°) a comparison is made between the observed temperature variations in the cosmic microwave background resulting from sound waves and the temperature variations in a hypothetical universe with no sound waves. Sound waves affect the distribution of temperature fluctuations, but do not entirely create them. Bottom panel: Observations of the cosmic background radiation show that hot and cold spots of certain angular sizes are more common than others. Matching a model that describes these observations (the red curve) helps to determine the values of important cosmological parameters. Most of the data shown here are from WMAP; the data for the smallest angles (at the right of the graph) come from the CBI detector in the Chilean Andes and the ACBAR and BOOMERANG detectors at the south pole.
(top panel: NASA/WMAP Science Team; graph: Adapted from “The Hubble Constant,” Wendy L. Freedman and Barry F. Madore, Carnegie Observatories)