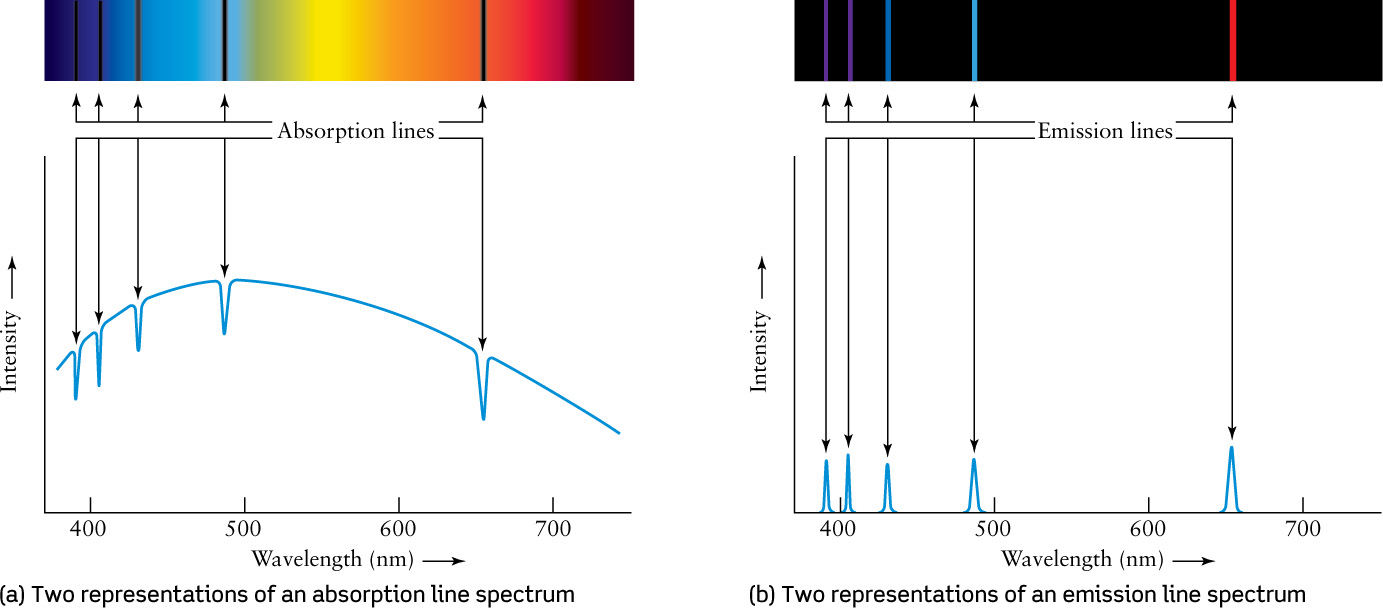
Figure 6-21: Two Ways to Represent Spectra When a CCD is placed at the focus of a spectrograph, it records the rainbow-colored spectrum. A computer program can be used to convert the recorded data into a graph of intensity versus wavelength. (a) Absorption lines appear as dips on such a graph, while (b) emission lines appear as peaks. The dark absorption lines and bright emission lines in this example are the Balmer lines of hydrogen (see Section 5-8).