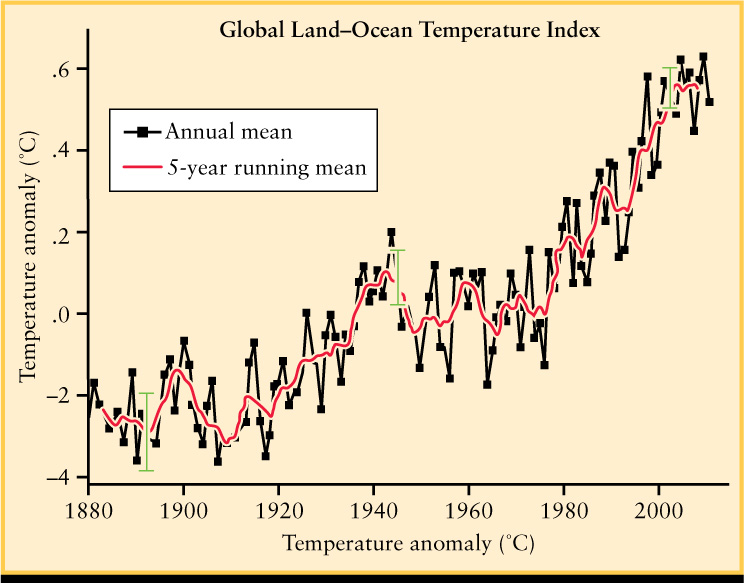
Figure 9-32: Global Warming Global temperatures have been rising. The annual temperature fluctuates quite a bit (the black line), and even the red plot of five-year averages shows periods where the temperature declines, but the overall trend of rising temperatures is firmly established. (The green error-bars show that uncertainties due to temperature variations are much smaller than the overall rise.) The temperature is the global mean over both land and ocean, and the temperature anomaly plotted on the vertical axis is just the temperature relative to the average that was measured during the period 1951 to 1980.