18-6 Young star clusters give insight into star formation and evolution
 Dark nebulae contain tens or hundreds of solar masses of gas and dust, enough to form many stars. As a consequence, these nebulae tend to form groups or clusters of young stars. One cluster still in the act of star formation is M16, shown in Figure 18-18. As a cluster ages, intense radiation transforms the dark nebula, producing a reddish H II region as in Figure 18-19.
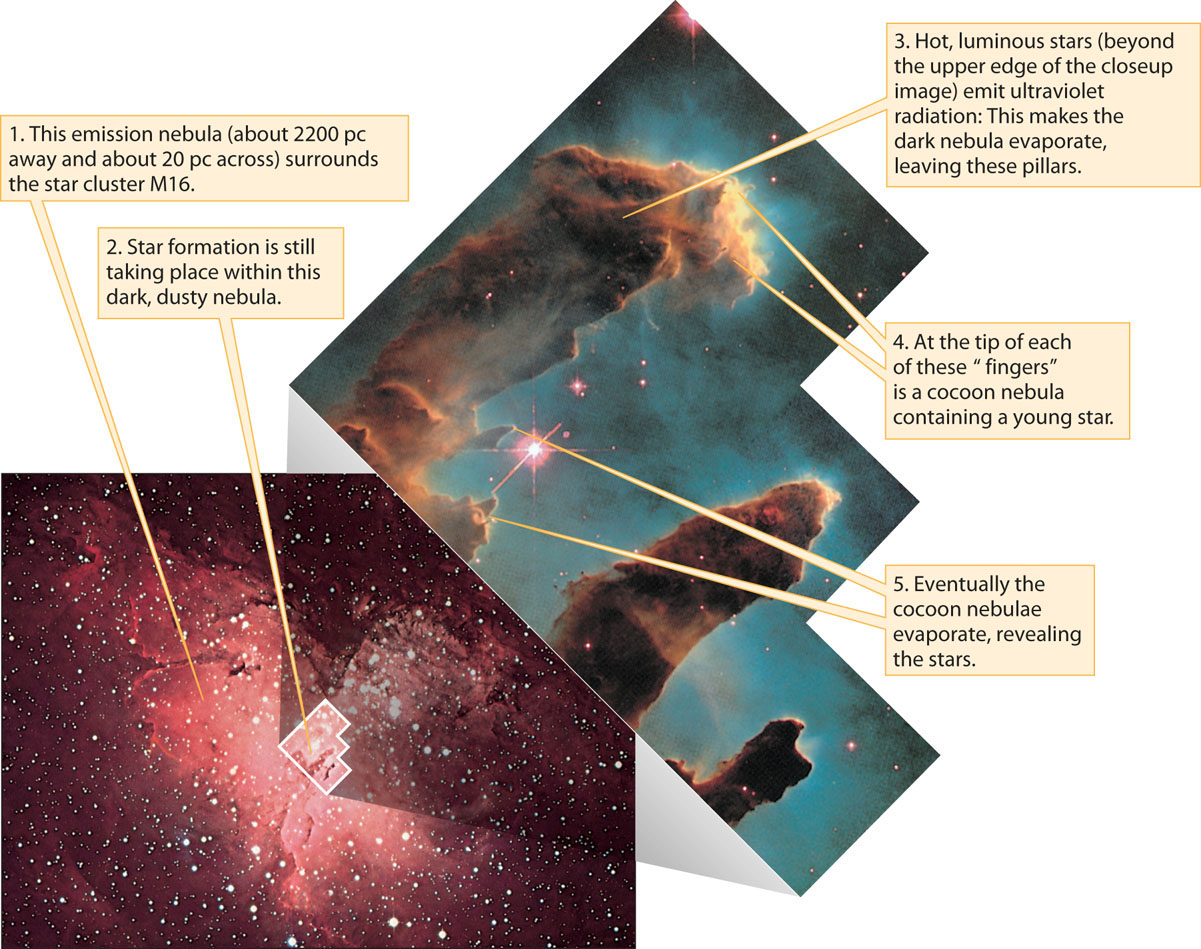
 Formation of a Star Cluster The star cluster M16 is thought to be no more than 800,000 years old, and star formation is still taking place within adjacent dark, dusty globules. Massive young stars in the cluster power red emission lines of the H II region (called the Eagle Nebula for its shape). The inset zooms in on three dense, cold pillars of gas with ongoing star formation. The pillar at the upper left extends about 0.3 pc (1 ly) from base to tip, and each of its “fingers” is somewhat broader than our entire solar system.
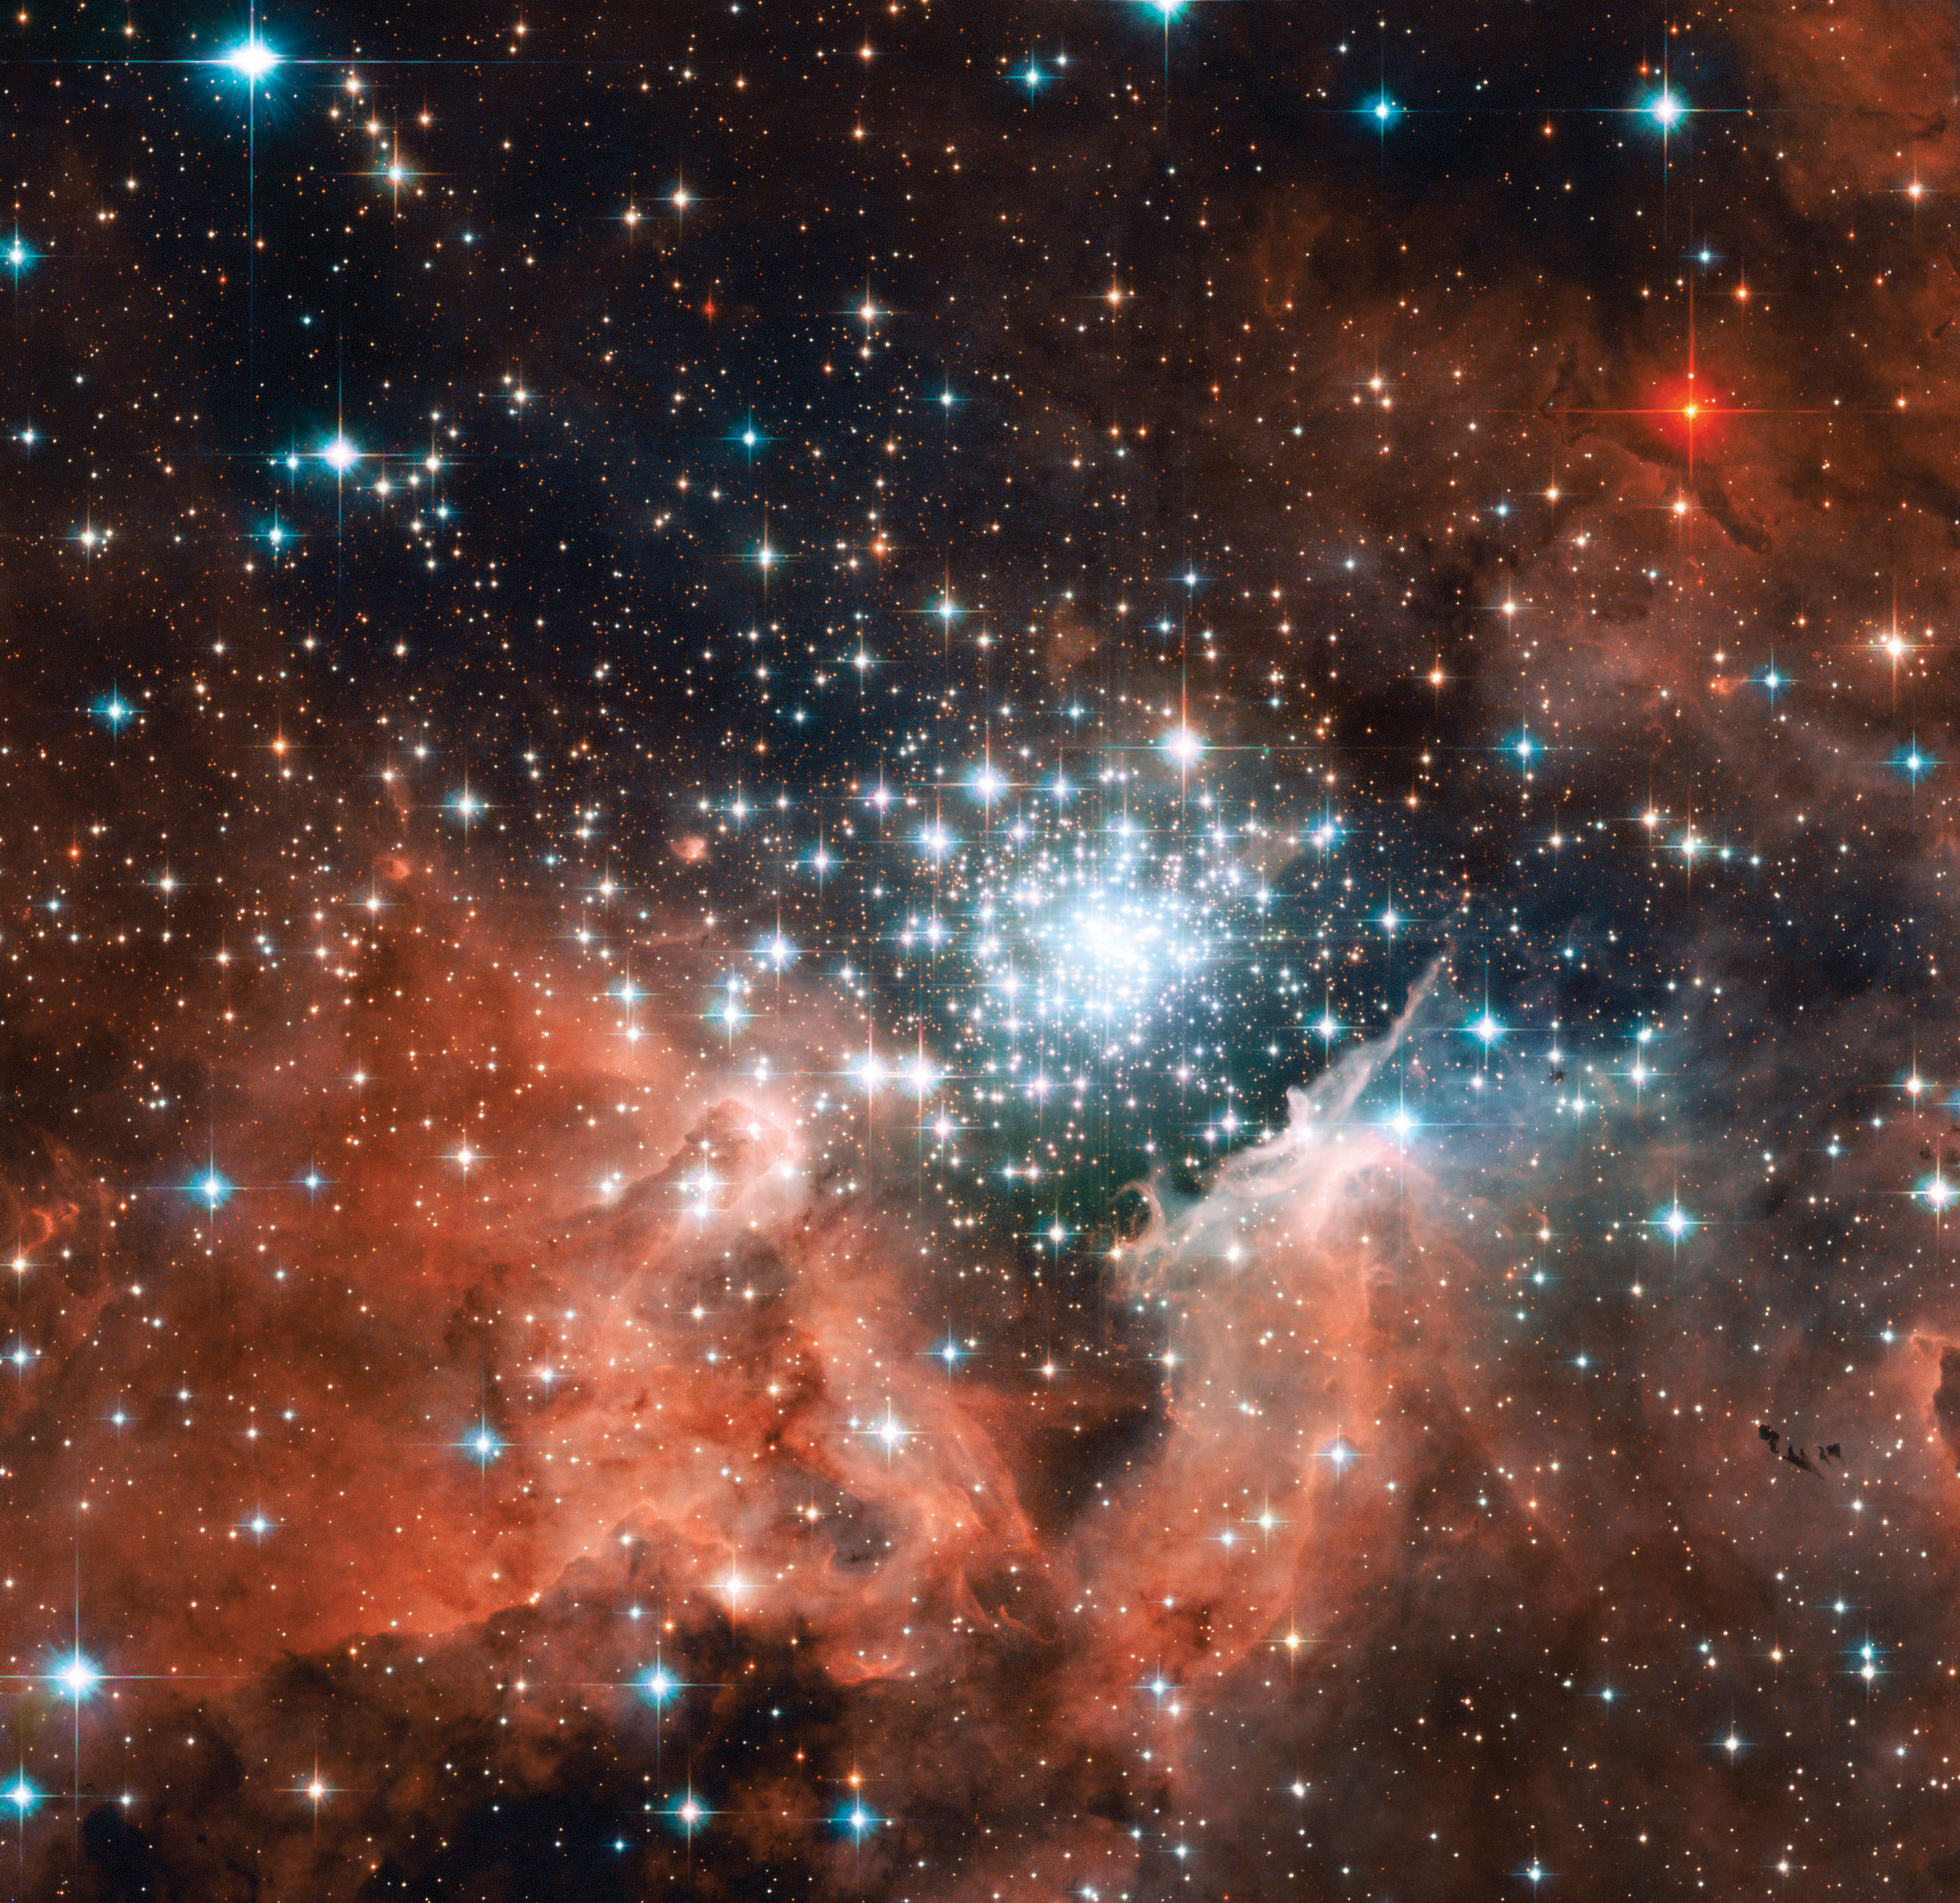
A Mature Star Cluster NGC 3603 is one the closest star clusters at only 20,000 ly away. Star formation has ended and ultraviolet light from its stars power the largest visible reddish H II region in our Galaxy.
518
Star Clusters as Evolutionary Laboratories
In addition to being objects of great natural beauty, star clusters give us a unique way to compare the evolution of different stars. That is because clusters typically include stars with a range of different masses, all of which began to form out of the parent nebula at roughly the same time.
All the stars in a cluster may begin to form nearly simultaneously, but they do not all become main-sequence stars at the same time. As you can see from their evolutionary tracks (see Figure 18-10), high-mass stars evolve more rapidly than low-mass stars. The more massive the protostar, the sooner it develops the central pressures and temperatures needed for steady hydrogen fusion to begin, thus joining the main sequence.
ANALOGY
A foot race is a useful way to compare the performance of sprinters because all the competitors start the race simultaneously. A young star cluster gives us the same kind of opportunity to compare the evolution of stars of different masses that all began to form roughly simultaneously. Unlike a foot race, however, the entire “race” of stellar evolution in a single cluster happens too slowly for us to observe; as Figure 18-10 shows, protostars take many thousands or millions of years to evolve significantly. Instead, we must compare different star clusters at various stages in their evolution to piece together the history of star formation in a cluster.
Upon reaching the main sequence, high-mass protostars become hot, ultraluminous stars of spectral types O and B. As we saw in Section 18-2, these types of stars have ultraviolet radiation that ionizes the surrounding interstellar medium to produce an H II region. Figure 18-18 shows such an H II region, called the Eagle Nebula, surrounding the young star cluster M16. A few hundred thousand years ago, this region of space would have had a far less dramatic appearance. It was then a dark nebula, with protostars just beginning to form. Over the intervening millennia, mass ejection from these evolving protostars swept away the obscuring dust. The exposed young, hot stars heated the relatively thin remnants of the original dark nebula, creating the H II region that we see today.
519
When the most massive protostars to form out of a dark nebula have reached the main sequence, other low-mass protostars are still evolving nearby within their dusty cocoons. The evolution of these low-mass stars can be disturbed by their more massive neighbors. As an example, the inset in Figure 18-18 is a close-up of part of the Eagle Nebula. Within these opaque pillars of cold gas and dust, protostars are still forming. At the same time, however, the pillars are being eroded by intense ultraviolet light from hot, massive stars that have already shed their cocoons. As each pillar evaporates, the embryonic stars within have their surrounding material stripped away prematurely, limiting the total mass that these stars can accrete.
Analyzing Young Clusters Using H-R Diagrams
Star clusters tell us still more about how high-mass and low-mass stars evolve. Figure 18-20a shows the young star cluster NGC 2264 and its associated emission nebula. Astronomers have measured each star’s apparent brightness and color ratio. Knowing the distance to the cluster, they have deduced the luminosities and surface temperatures of the stars (see Section 17-2 and Section 17-4). Figure 18-20b shows all these stars on an H-R diagram. Note that the hottest and most massive stars, with surface temperatures around 20,000 K, are on the main sequence. Stars cooler than about 10,000 K, however, have not yet quite arrived at the main sequence. These are less massive stars in the final stages of pre–main-sequence contraction and are just now beginning to ignite thermonuclear reactions at their centers. To find the ages of these stars, we can compare Figure 18-20b with the theoretical calculations of protostar evolution in Figure 18-10. It turns out that this particular cluster is probably about 2 million years old.
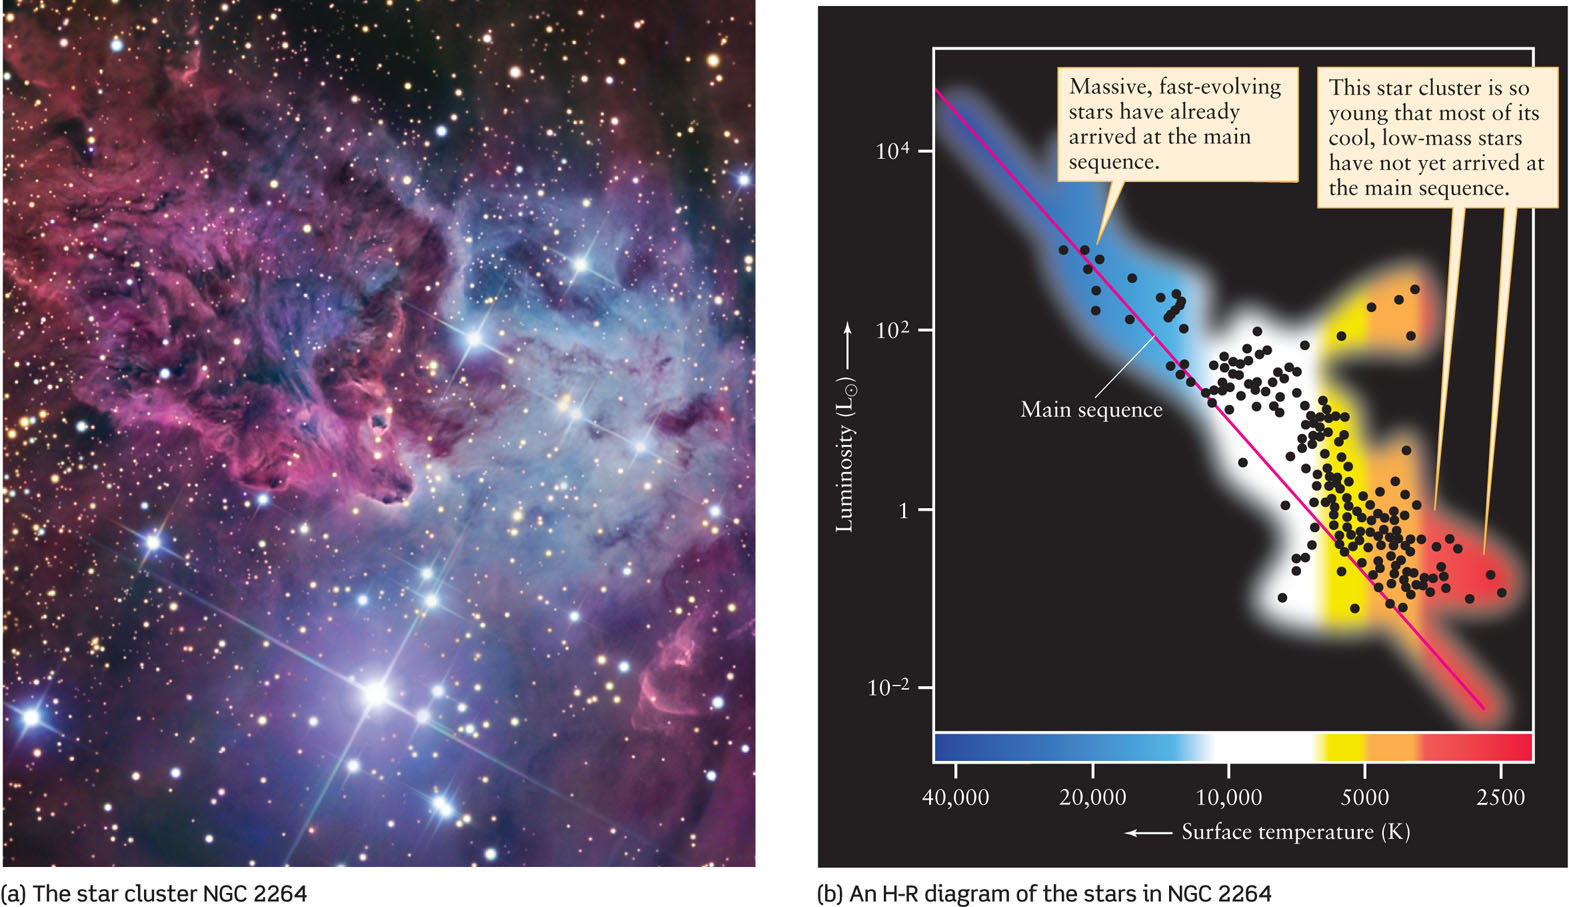
A Young Star Cluster and Its H-R Diagram (a) This image shows the young star cluster NGC 2264 in a reddish H II region known as the Fox Fur Nebula. Stars within the cluster provide the ultraviolet light that powers this emission nebula. The cluster lies about 800 pc (2600 ly) from Earth. (b) Each dot plotted on this H-R diagram represents a star in NGC 2264 whose luminosity and surface temperature have been determined. This star cluster probably started forming only 2 million years ago, and its lower-mass stars have not yet reached the main sequence.
The H-R diagram of a young cluster reveals how much time has elapsed since its stars began to form
520
Figure 18-21a shows another young star cluster called the Pleiades. The photograph shows gas that must once have formed an H II region around this cluster and has dissipated into interstellar space, leaving only traces of dusty material that forms reflection nebulae around the cluster’s stars. This implies that the Pleiades must be older than NGC 2264, the cluster in Figure 18-20a, which is still surrounded by an H II region. The H-R diagram for the Pleiades in Figure 18-21b bears out this idea. In contrast to the H-R diagram for NGC 2264, nearly all the stars in the Pleiades are on the main sequence. The cluster’s age is about 50 million years, which is how long it takes for the least massive stars to finally begin hydrogen fusion in their cores.
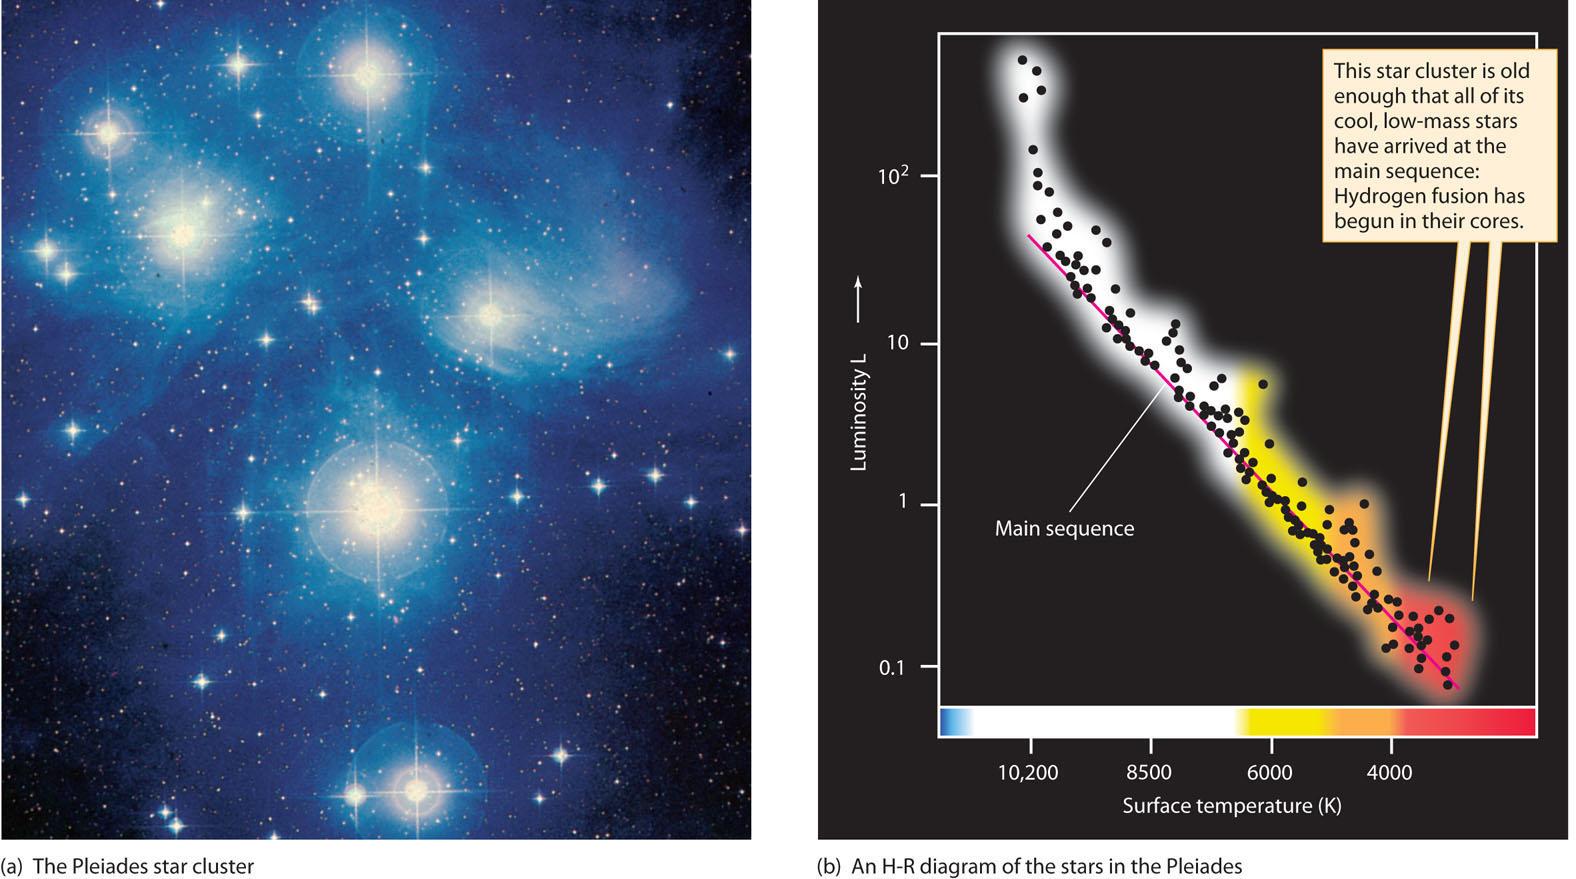
The Pleiades and Its H-R Diagram (a) The Pleiades star cluster is 117 pc (380 ly) from Earth in the constellation Taurus and can be seen with the naked eye. (b) Each dot plotted on this H-R diagram represents a star in the Pleiades whose luminosity and surface temperature have been measured. (Note: The scales on this H-R diagram are different from those in Figure 18-18b.) The Pleiades is about 50 million (5 × 10⁷) years old.
CAUTION!
Note that the data points for the most massive stars in the Pleiades (at the upper left of the H-R diagram in Figure 18-21b) lie above the main sequence. This is not because these stars have yet to arrive at the main sequence. Rather, these stars were the first members of the cluster to arrive at the main sequence some time ago and are now the first members to leave it. They have used up the hydrogen in their cores, so the steady process of core hydrogen fusion that characterizes main-sequence stars cannot continue. In Chapter 19 we will see why massive stars spend a rather short time as main-sequence stars and will study what happens to stars after the main-sequence phase of their lives.
There are two ways to get the ages of clusters with H-R diagrams. What we have seen in Figure 18-20 and Figure 18-21 is for young clusters. The age is estimated by figuring out how long it takes the less massive, slower-evolving protostars to arrive at the main sequence. In the next chapter (Section 19-4), we will estimate the ages of old clusters by determining how long it has taken more massive stars to leave the main sequence.
521
A loose collection of stars such as NGC 2264 or the Pleiades is referred to as an open cluster (or galactic cluster, since such clusters are usually found in the plane of the Milky Way Galaxy). Open clusters possess barely enough mass to hold themselves together by gravitation. Occasionally, a star moving faster than average will escape, or “evaporate,” from an open cluster. Indeed, by the time the stars are a few billion years old, they may be so widely separated that a cluster no longer exists.
If a group of stars is gravitationally unbound from the very beginning—that is, if the stars are moving away from one another so rapidly that gravitational forces cannot keep them together—then the group is called a stellar association. Because young stellar associations are typically dominated by luminous O and B main-sequence stars, they are also called OB associations. The image that opens this chapter shows part of an OB association in the southern constellation Ara (the Altar).
CONCEPT CHECK 18-7
Consider the pillars shown in the inset of Figure 18-18. Are the pillars eroded away by the stars forming in their cocoon nebulae within the pillars?