23-6 Galaxies are grouped into clusters and superclusters
Galaxies are not scattered randomly throughout the universe but are found in clusters. Figure 23-18 shows one such cluster. Like stars within a star cluster, the members of a cluster of galaxies are in continual motion around one another. They appear to be at rest only because they are so distant from us.
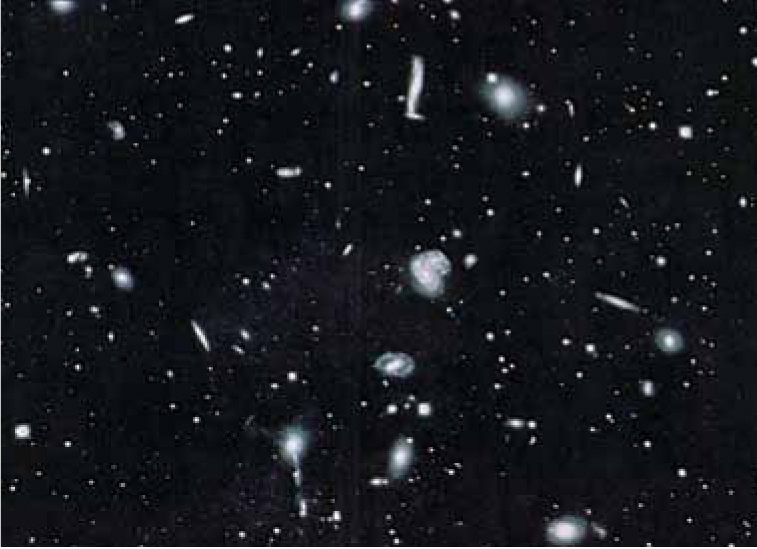
The Hercules Cluster This irregular cluster of galaxies is about 200 Mpc (650 million ly) from Earth. The Hercules cluster contains many spiral galaxies, often associated in pairs and small groups.
Clusters of Galaxies: Poor and Rich, Regular and Irregular
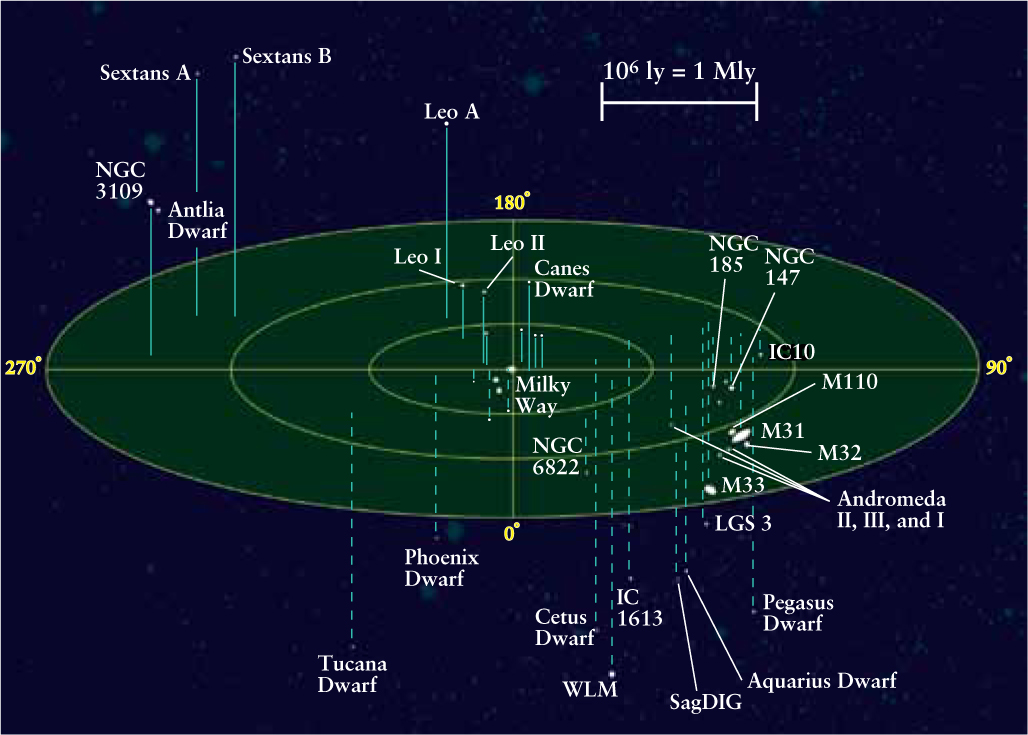
A cluster is said to be either poor or rich, depending on how many galaxies it contains. Poor clusters, which far outnumber rich ones, are often called groups. For example, the Milky Way Galaxy, the Andromeda Galaxy (M31), and the Large and Small Magellanic clouds belong to a poor cluster familiarly known as the Local Group. The Local Group contains more than 40 galaxies, most of which are dwarf ellipticals (see Figure 23-9). Figure 23-19 is a map of a portion of the Local Group.
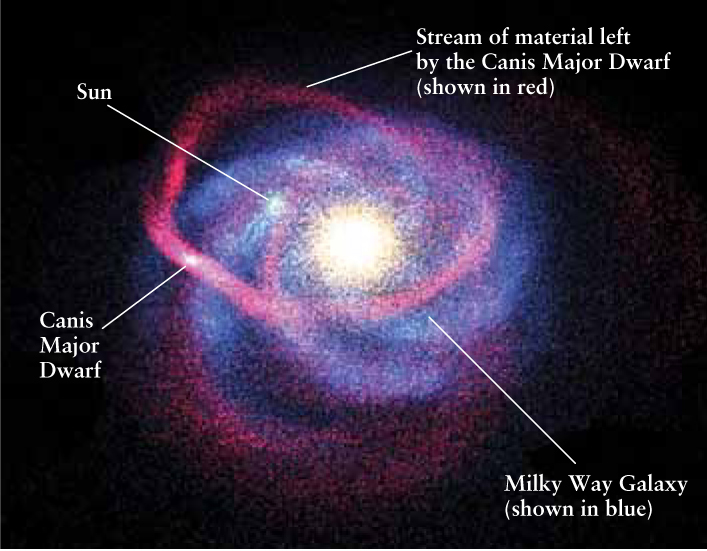
 The Canis Major Dwarf Discovered in 2003, this dwarf elliptical galaxy is actually slightly closer to Earth than is the center of the Milky Way Galaxy. This illustration shows the stream of material left behind by the Canis Major Dwarf as it orbits the Milky Way. This material is torn away by the Milky Way’s tidal forces (see Section 4-8).
In recent years, astronomers have discovered several previously unknown dwarf elliptical galaxies in the Local Group. Two recently discovered dwarf elliptical galaxies are Leo T and the Canis Major Dwarf. Tidal forces exerted by the Milky Way on the Canis Major Dwarf are causing this dwarf galaxy to gradually disintegrate and leave a trail of debris behind it (Figure 23-20). This galaxy is about 13 kpc (42,000 ly) from the center of the Milky Way Galaxy and a mere 8 kpc (25,000 ly) from Earth (about the same as the distance from Earth to the center of the Milky Way).
We may never know the total number of galaxies in the Local Group, because dust in the plane of the Milky Way obscures our view over a considerable region of the sky. Nevertheless, we can be certain that no additional large spiral galaxies are hidden by the Milky Way. Radio astronomers would have detected 21-cm radiation from them, even though their visible light is completely absorbed by interstellar dust.
The nearest fairly rich cluster is the Virgo cluster, a collection of more than 2000 galaxies covering a 10° × 12° area of the sky. Figure 23-8 shows a portion of this cluster. One member of this cluster not shown in Figure 23-8 is the spiral galaxy M100; measurements of Cepheid variables in M100 (see Figure 23-4) give a distance of about 17 Mpc (56 million ly). The Tully-Fisher relation and observations of Type Ia supernovae (see Figure 23-13) give similar distances to this cluster. The overall diameter of the cluster is about 3 Mpc (9 million ly).
683
The center of the Virgo cluster is dominated by three giant elliptical galaxies. You can see two of these, M84 and M86, in Figure 23-8. The diameter of each of these enormous galaxies is comparable to the 750-kpc distance between the Milky Way and the Andromeda Galaxy. In other words, one giant elliptical is approximately the same size as the entire Local Group!
Astronomers also categorize clusters of galaxies as regular or irregular, depending on the overall shape of the cluster. The Virgo cluster, for example, is called an irregular cluster, because its galaxies are scattered throughout a sprawling region of the sky. Our own Local Group is also an irregular cluster. In contrast, a regular cluster has a distinctly spherical appearance, with a marked concentration of galaxies at its center.
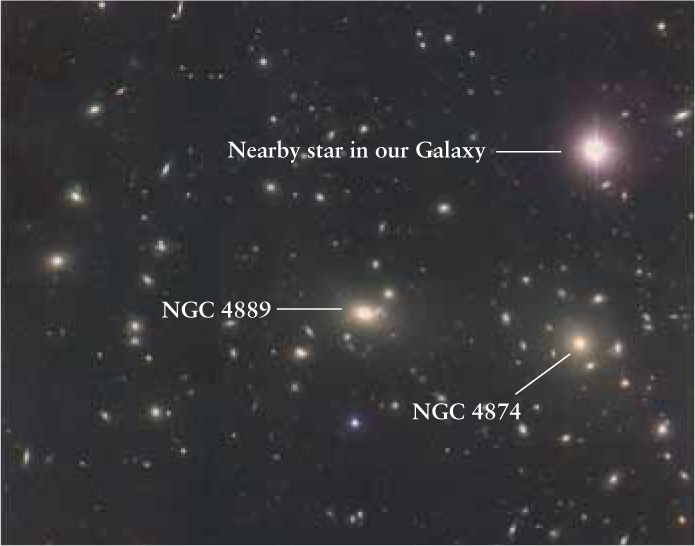
The nearest example of a rich, regular cluster is the Coma cluster, located about 90 Mpc (300 million light-years) from us toward the constellation Coma Berenices (Berenice’s Hair) (Figure 23-21). Despite its great distance, telescopic images of this cluster show more than 1000 galaxies. The Coma cluster almost certainly contains many thousands of dwarf ellipticals, so the total membership of the cluster may be as many as 10,000 galaxies. The core of the Coma cluster is dominated by two giant ellipticals surrounded by many normal-sized galaxies.
The overall shape of a cluster is related to the dominant types of galaxies it contains. Rich, regular clusters contain mostly elliptical and lenticular galaxies. For example, about 80% of the brightest galaxies in the Coma cluster (see Figure 23-21) are ellipticals; only a few spiral galaxies are scattered around the cluster’s outer regions. Irregular clusters, such as the Virgo cluster and the Hercules cluster shown in Figure 23-18, have a more even mixture of galaxy types.
CONCEPT CHECK 23-11
How would a photograph of a rich cluster’s appearance compare to that of a poor cluster?
Superclusters: Clusters of Clusters of Galaxies
Clusters of galaxies are themselves grouped together in huge associations called superclusters. A typical supercluster contains dozens of individual clusters spread over a region of space up to 45 Mpc (150 million ly) across. Figure 23-22 shows the distribution of clusters in our part of the universe. The nearer ones out to the Virgo cluster, including our own Local Group, are members of the Local Supercluster. The other clusters shown in Figure 23-22 belong to other superclusters. The most massive cluster in the local universe is called the Great Attractor; its gravity is so great that the Milky Way, as well as the rest of the Local Supercluster, is moving toward it at speeds of several hundred kilometers per second.
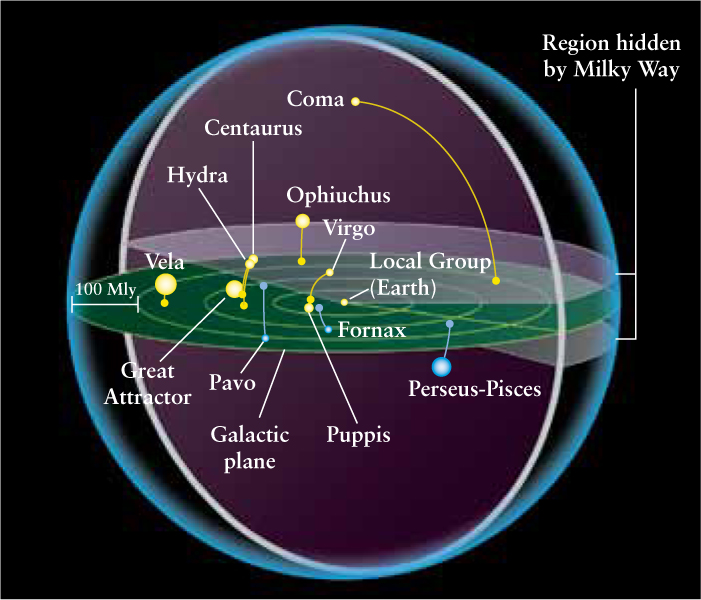
Observations indicate that unlike clusters, superclusters are not bound together by gravity. That is, most clusters in each supercluster are drifting away from most of the other clusters in that same supercluster. Furthermore, the superclusters are all moving away from each other due to the Hubble flow.
684
Cosmic Voids and Sheets: The Distribution of Superclusters
Superclusters of galaxies are not spread uniformly across the universe, but are found in vast sheets separated by truly immense voids
Since the 1980s, astronomers have been working to understand how superclusters are distributed in space. Some of this structure is revealed by maps such as that shown in Figure 23-23, which displays the positions on the sky of 1.6 million galaxies. Such maps reveal that superclusters are not randomly distributed, but seem to lie along filaments. But to comprehend more fully the distribution of superclusters, it is necessary to map their positions in three dimensions. Their positions are mapped by measuring both the position of a galaxy on the sky as well as the galaxy’s redshift. Using the Hubble law (see Section 23-5), astronomers can use each galaxy’s redshift to estimate its distance from Earth and thus its position in three-dimensional space.
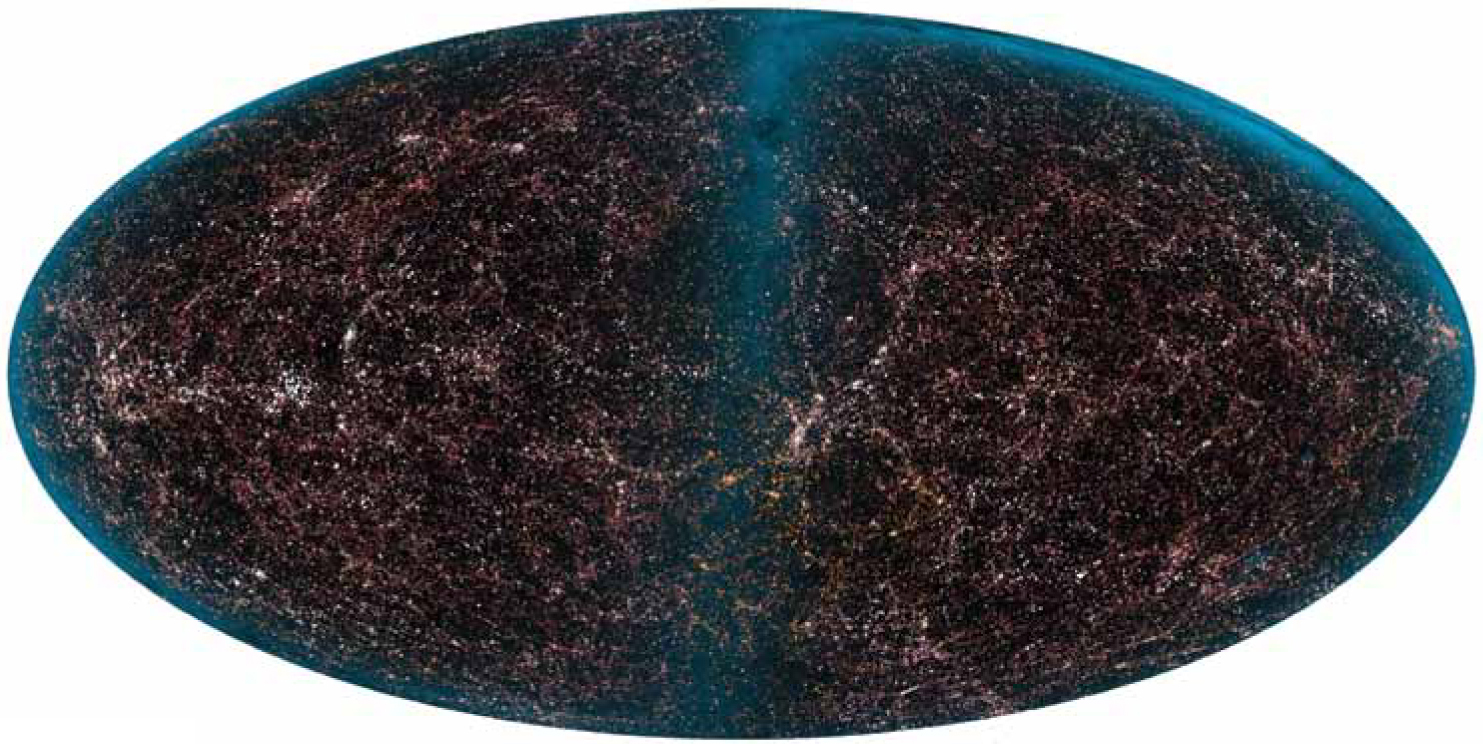
Structure in the Nearby Universe This composite infrared image from the 2MASS (Two-Micron All-Sky Survey) project shows the light from 1.6 million galaxies. In this image, the entire sky is projected onto an oval; the blue band running vertically across the center of the image is light from the plane of the Milky Way. Note that galaxies form a lacy, filamentary structure. Note also the large, dark voids that contain few galaxies.
The first three-dimensional maps of this kind were made in the 1970s and included measurements of a few hundred galaxies. Collecting the data for such maps required many months or years of telescopic observations. Technology for astronomy has advanced tremendously since then, and it is now possible to measure the redshifts of 400 galaxies in a single hour!
Two extensive galaxy maps are from the Sloan Digital Sky Survey and from the Two Degree Field Galactic Redshift Survey (2dF). (The name refers to the 2° field of view of the telescope used for the observations, which is unusually wide for a research telescope.) Figure 23-24a shows a map made from 2dF measurements of more than 60,000 galaxies. This particular map encompasses two wedge-shaped slices of the universe, one on either side of the plane of the Milky Way (Figure 23-24b). Earth (in the Milky Way) is at the apex of the wedge-shaped map; each dot represents a galaxy. The measurements used to create this map included galaxies with redshifts as large as z = 0.25, corresponding to a recessional velocity of 66,000 km/s. Using a Hubble constant of 73 km/s/Mpc, you can determine that the map in Figure 23-24a extends out to a distance of nearly 1000 Mpc, or 3 billion light-years from Earth.
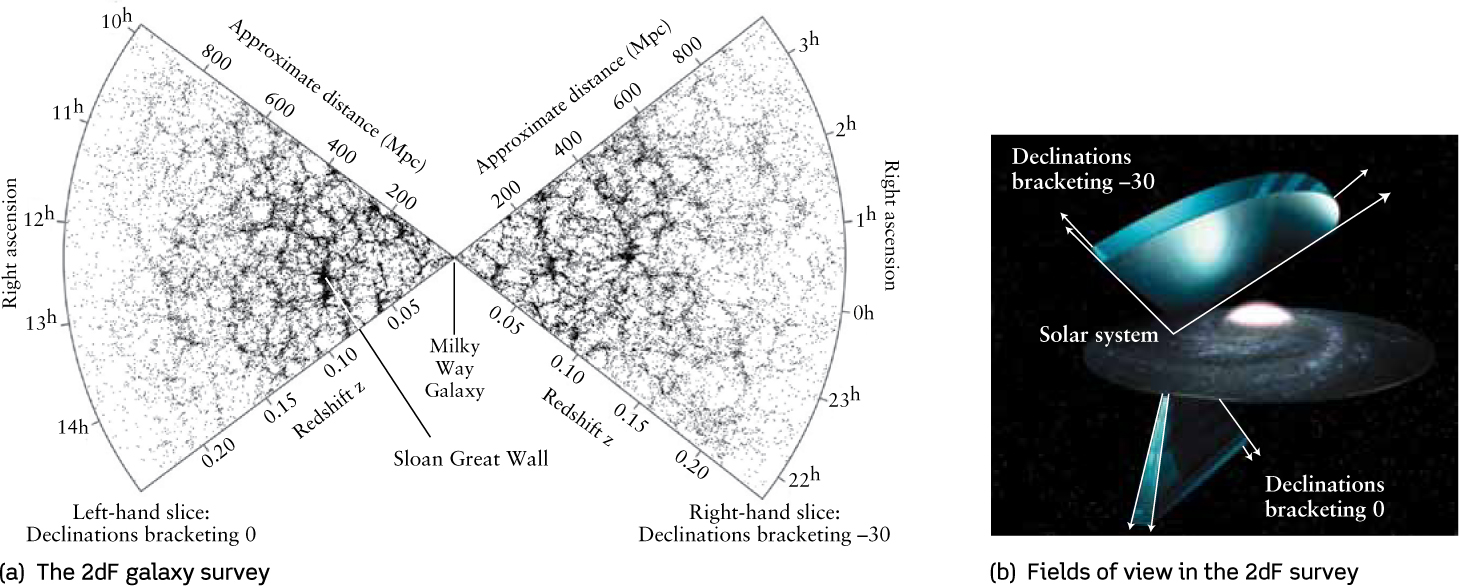
 The Large-Scale Distribution of Galaxies (a) This map shows the distribution of 62,559 galaxies in two wedges extending out to redshift z = 0.25. (For an explanation of right ascension and declination, see Box 2-1.) Note the prominent voids surrounded by thin regions full of galaxies. (b) The two wedges shown in (a) lie roughly perpendicular to the plane of the Milky Way. These were chosen to avoid the obscuring dust that lies in our Galaxy’s plane.
685
Maps such as that shown in Figure 23-24a reveal enormous voids where exceptionally few galaxies are found. (These voids were first discovered in 1978 in a pioneering study by Stephen Gregory and Laird Thompson at the Kitt Peak National Observatory.) These voids are roughly spherical and measure 30 to 120 Mpc (100 million to 400 million ly) in diameter. They are not entirely empty, however. There is evidence for hydrogen clouds in some voids, while others may be subdivided by strings of dim galaxies.
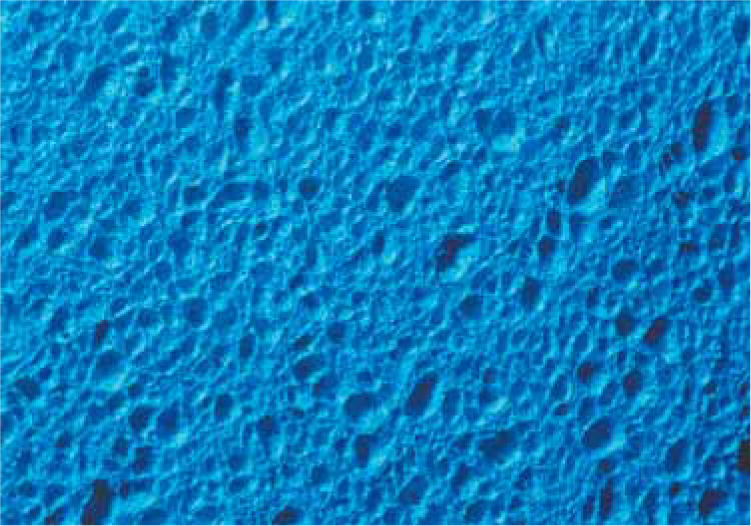
Figure 23-24a shows that most galaxies are concentrated in sheets on the surfaces between voids. These sheets can be more than 100 Mpc long and several megaparsecs thick. This pattern is similar to the structure of a sponge or soap bubbles, with sheets of soap film (analogous to galaxies) surrounding air bubbles (analogous to voids) (Figure 23-25). These titanic sheets of galaxies are the largest structures known in the universe: On scales much larger than 100 Mpc, the distribution of galaxies in the universe appears to be roughly uniform. As we will see in Chapter 26, this pattern of sheets and voids contains important clues about how clusters of galaxies formed in the early universe.
There is an unusually large and dense sheet in Figure 23-24a called the Sloan Great Wall; this is the largest known structure in the universe! This structure is about 1.4 billion light-years in length (which is almost 2% of the visible universe). The Sloan Great Wall contains several superclusters, and astronomers still have not figured out how this large structure formed.
686
CONCEPT CHECK 23-12
Are superclusters evenly distributed throughout the universe?
CONCEPT CHECK 23-13
What is the most common type of galaxy in our Local Group?