25-4 The microwave radiation that fills all space is evidence of a hot Big Bang
 One of the major advances in twentieth-century astronomy was the discovery of the origin of the heavy elements. We know today that essentially all the heavy elements are created by thermonuclear reactions at the centers of stars and in supernovae (see Chapter 20). The starting point of all these reactions is the fusion of hydrogen into helium, which we described in Section 16-1. But as astronomers began to understand the details of thermonuclear synthesis in the 1960s, they were faced with a dilemma: There is far more helium in the universe than could have been created by hydrogen fusion in stars.
For example, the Sun consists of about 74% hydrogen and 25% helium by mass, and the universe as a whole is also about 25% helium. Some helium was produced by the thermonuclear fusion of hydrogen within stars, but calculations show that the amount of helium produced in this way is not nearly enough to account for the large fraction of helium observed in the universe. Because it was thought that the universe originally contained only hydrogen—the simplest of all the chemical elements—the presence of so much helium posed a major dilemma.
A Hot Big Bang and the Cosmic Microwave Background
Shortly after World War II, Ralph Alpher and Robert Hermann proposed that the universe immediately following the Big Bang must have been so incredibly hot that thermonuclear reactions occurred everywhere throughout space. Calculations for the amount of helium (and some other elements) produced by thermonuclear reactions in the first few minutes after the Big Bang are in extraordinary agreement with observations. This astounding prediction of the Big Bang was confirmed by detailed observations, which means that strong evidence for the Big Bang goes all the way back to the first few minutes of the universe.
730
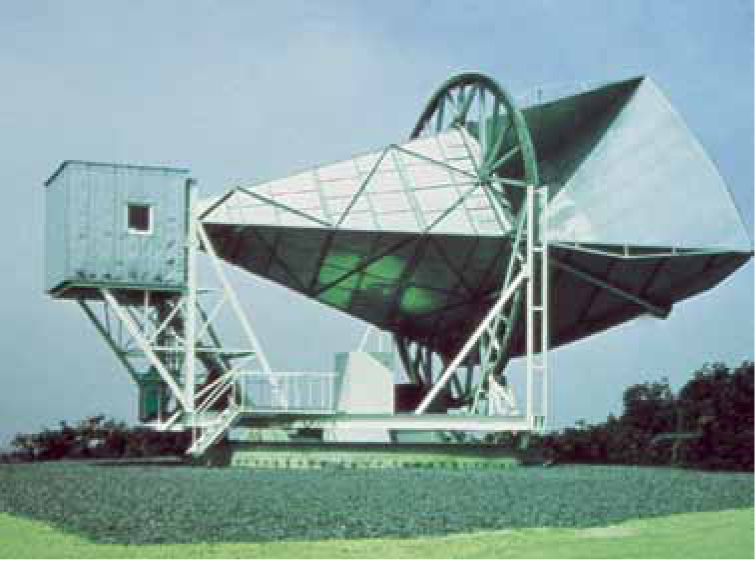
The Bell Labs Horn Antenna Using this microwave horn antenna, originally built for communications purposes, Arno Penzias and Robert Wilson detected a signal that seemed to come from all parts of the sky. After carefully removing all potential sources of electronic “noise” (including bird droppings inside the antenna) that could create a false signal, Penzias and Wilson realized that they were actually detecting radiation from space. This radiation is the afterglow of the Big Bang.
Fortunately, predictions coming from the Big Bang theory did not stop there. Princeton University physicists Robert Dicke and P. J. E. Peebles calculated that in order for the entire universe to undergo the required thermonuclear reactions, in addition to charged particles, the early universe must have been very hot and filled with many high-energy, short-wavelength photons. With these photons interacting strongly with the “soup” of charged particles, the intensity distribution of photons formed blackbody radiation (see Figure 5-12).
The universe has expanded so much since those ancient times that all those short-wavelength photons have had their wavelengths stretched by a tremendous factor. As a result, they have become low-energy, long-wavelength photons. The temperature of this cosmic radiation field is now only a few degrees above absolute zero. By Wien’s law, radiation at such a low temperature should have its peak intensity at microwave wavelengths of approximately 1 millimeter. Hence, this radiation field, which fills all of space, is called the cosmic microwave background (CMB), or cosmic background radiation. In the early 1960s, Dicke and his colleagues began designing an antenna to detect this microwave radiation.
Meanwhile, just a few miles from Princeton University, Arno Penzias and Robert Wilson of Bell Telephone Laboratories in New Jersey were working on a new microwave horn antenna designed to relay telephone calls to Earth-orbiting communications satellites (Figure 25-6). Penzias and Wilson were deeply puzzled when, no matter where in the sky they pointed their antenna, they detected faint background noise. Thanks to a colleague, they learned about the work of Dicke and Peebles and realized that they had discovered the cooled-down cosmic background radiation left over from the hot Big Bang. Penzias and Wilson shared the 1978 Nobel Prize in Physics for their discovery.
The afterglow of the Big Bang was first discovered by a happy coincidence—and can be detected with an ordinary television
A TV using an antenna for signal reception (as opposed to cable or a satellite dish) can actually detect cosmic background radiation. This radiation is responsible for about 1% of the random noise or “hash” that appears on the screen when you tune a television to a station that is off the air. Using far more sophisticated detectors than TV sets, scientists have made many measurements of the intensity of the background radiation at a variety of wavelengths. Unfortunately, Earth’s atmosphere is almost totally opaque to wavelengths between about 10 μm and 1 cm (see Figure 6-25), which is just the wavelength range in which the background radiation is most intense. As a result, scientists have had to place detectors either on high-altitude balloons (which can fly above the majority of the obscuring atmosphere) or, even better, on board orbiting spacecraft.
A Detailed Look at the Cosmic Microwave Background
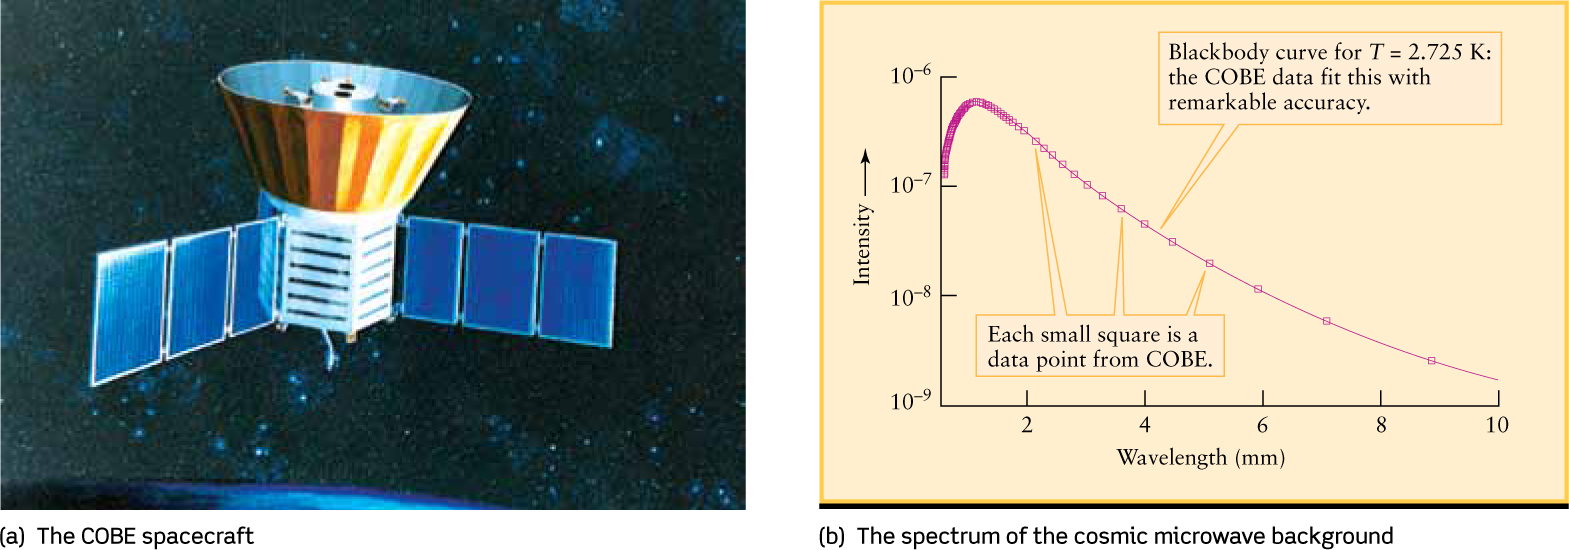
The first high-precision measurements of the cosmic microwave background came from the Cosmic Background Explorer (COBE, pronounced “coe-bee”) satellite, which was placed in Earth orbit in 1989 (Figure 25-7a). Data from COBE’s spectrometer, shown in Figure 25-7b, demonstrate that this ancient radiation has the spectrum of a blackbody with a temperature of 2.725 K. In recognition of this discovery, as well as others that we will discuss in Section 25-5, COBE team leaders John Mather of NASA and George Smoot of the University of California, Berkeley, were awarded the 2006 Nobel Prize in Physics.
An important feature of the microwave background is that its intensity is almost perfectly isotropic, that is, the same in all directions. In other words, we detect nearly the same background intensity from all parts of the sky. This is a striking confirmation of Einstein’s assumption that the universe is isotropic (see Section 25-2). However, extremely accurate measurements, first made from high-flying airplanes and later from high-altitude balloons and from COBE, reveal a very slight variation in temperature across the sky. The microwave background appears slightly warmer than average toward the constellation of Leo and slightly cooler than average in the opposite direction toward Aquarius. Between the warm spot in Leo and the cool spot in Aquarius, the background temperature declines smoothly across the sky. Figure 25-8 is a map of the microwave sky showing this variation.
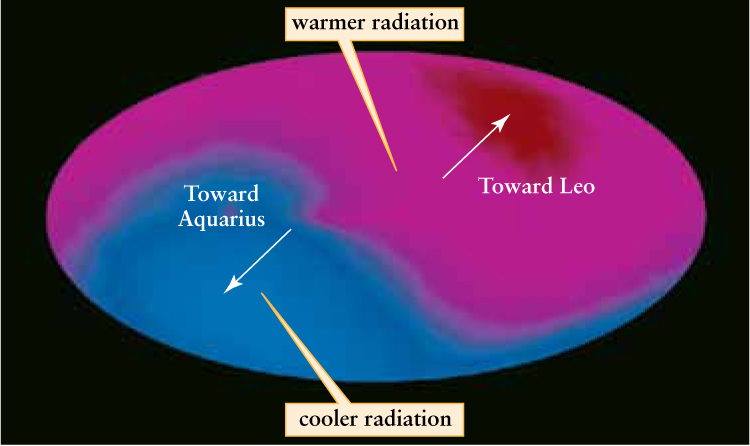
The Microwave Sky In this map of the entire sky made from COBE data, the plane of the Milky Way runs horizontally across the map, with the galactic center in the middle. Color indicates temperature—red is warm and blue is cool. The small temperature variation across the sky—only 0.0033 K above or below the average radiation temperature of 2.725 K—is caused by Earth’s motion through the microwave background.
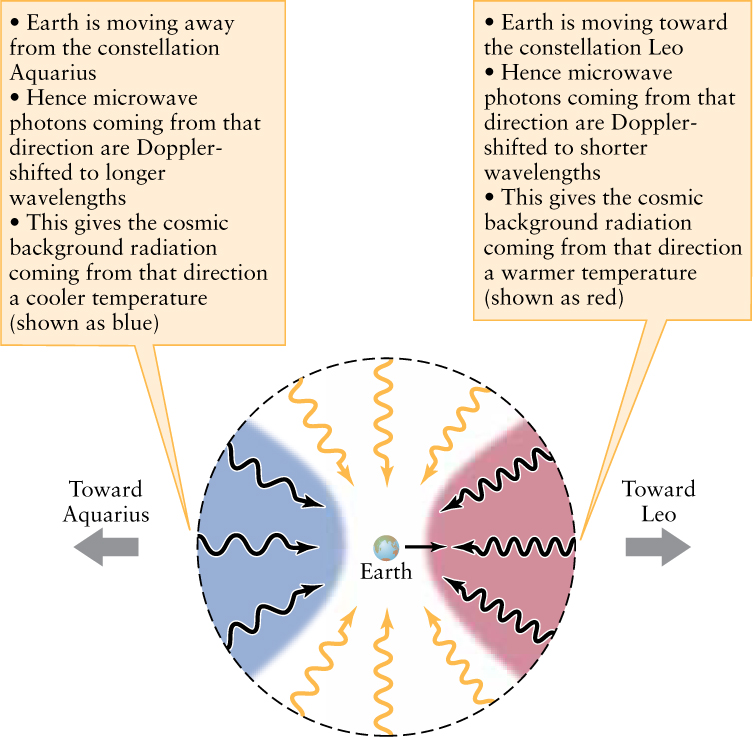
This apparent variation in temperature is caused by Earth’s motion through the cosmos. If we were at rest with respect to the microwave background, the radiation would be even more nearly isotropic. Because we are moving through this radiation field, however, we see a Doppler shift. Specifically, we see shorter-than-average wavelengths in the direction toward which we are moving, as drawn in Figure 25-9. A decrease in wavelength corresponds to an increase in photon energy and thus an increase in the temperature of the radiation. The slight temperature excess observed, about 0.00337 K, corresponds to a speed of 371 km/s. Conversely, we see longer-than-average wavelengths in that part of the sky from which we are receding. An increase in wavelength corresponds to a decline in photon energy and, hence, a decline in radiation temperature.
731
Our solar system is thus traveling away from Aquarius and toward Leo at a speed of 371 km/s. Taking into account the known velocity of the Sun around the center of our Galaxy, we find that the entire Local Group of galaxies, including our Milky Way Galaxy, is moving at about 620 km/s toward the Hydra-Centaurus supercluster. Observations show that thousands of other galaxies are being carried in this direction, as is the Hydra-Centaurus supercluster itself. This tremendous flow of matter is thought to be due to the gravitational pull of an enormous collection of visible galaxies and dark matter lying in that direction. This immense object, dubbed the Great Attractor, lies about 50 Mpc (150 million ly) from Earth (see Figure 23-22).
732
The existence of such concentrations of mass, as well as the existence of superclusters of galaxies (see Section 21-6), shows that the universe is rather “lumpy” on scales of 100 Mpc or smaller. It is only on larger scales that the universe is homogeneous and isotropic.
CONCEPT CHECK 25-7
If the early universe was filled with high-energy, short-wavelength photons, why are these observed today to be low-energy, long-wavelength microwave photons?