25-8 Primordial sound waves help reveal the character of the universe
We have seen how studying the “hot spots” in the cosmic background radiation reveals that we live in a flat universe. In fact, temperature variations reveal more: They give us a window on conditions in the early universe, and actually help us pin down the values of other important quantities such as the Hubble constant and the density of matter in the universe. The key to extracting this additional information from the cosmic background radiation is recognizing that the hot and cold spots in a map such as Figure 25-13 actually result from sound waves.
Sound Waves in the Early Universe
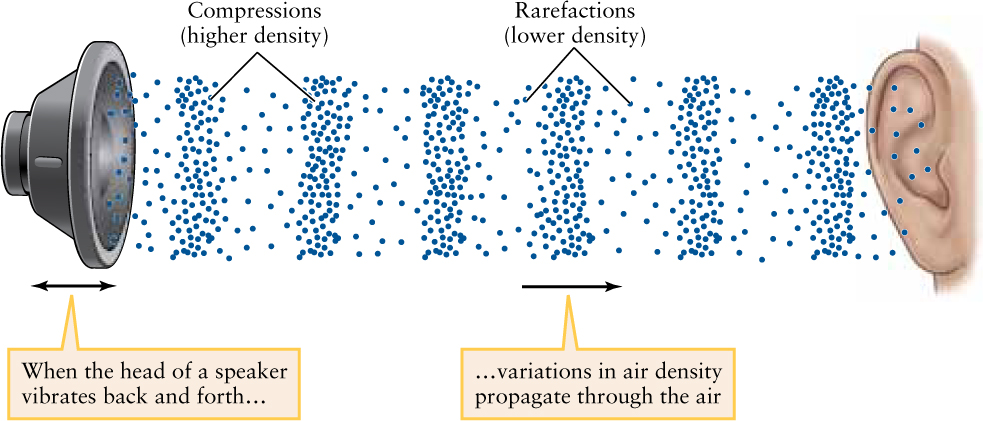
Sound waves can travel in gases and fluids of all kinds. Sound waves in air are used in human speech and hearing, while whales communicate using high-frequency underwater clicks and whistles. If you could take a snapshot of a sound wave, you would see that at any moment there are some regions, called compressions, where the gas or fluid is squeezed together, and other regions, called rarefactions, where the gas or fluid is thinned out or rarefied (Figure 25-20).
Immense sound waves in the early universe left their imprint as variations in the cosmic microwave background
744
There would also have been sound waves in the early universe before recombination. During the first 380,000 years after the Big Bang, the universe was filled with a fluidlike medium composed primarily of photons, electrons, and protons, with a density more than 109 times greater than that of our present-day universe. Just as water molecules in a glass of water collide with each other, photons and particles collided frequently with each other in this primordial fluid, triggering random sound waves with compressions and rarefactions.
Before discussing the sound waves in more depth, it is worth revisiting the relationship discussed in Section 25-5 between temperature and density variations. Because there was more mass in a compression than in a rarefaction, photons emerging from a compression experienced a greater gravitational redshift than did photons emerging from a rarefaction (see Section 21-2). As a result, the light from a compression is shifted to slightly longer wavelengths. We saw in Section 5-3 and Section 5-4 that a blackbody spectrum dominated by longer wavelengths corresponds to a lower blackbody temperature (see Figure 5-11). Hence, we see compressions as the blue cold spots in Figure 25-13, and we see rarefactions as the red hot spots. The overall pattern of cold and hot spots is thus a record of the density variations due to sound waves that were present just as the universe became transparent, some 380,000 years after the Big Bang. From the denser compressions arose our present-day population of galaxies.
The nature of a sound wave depends on the material through which it passes. For example, sound waves travel faster in helium than they do in air (because helium is less dense) and faster still in water (which, while denser than air, is much more resistant to compression). So, by studying the primordial sound waves recorded in Figure 25-13, we can learn about the properties of the fluid that made up the early universe. These properties include the average densities of matter and dark energy in the fluid, as well as the value of the Hubble constant (which helps determine how rapidly the fluid was expanding and thinning out as the universe expanded). We can also determine the age of the universe at the time that the cosmic background radiation was emitted, since this determines the maximum size to which a hot spot (rarefaction) or cold spot (compression) could have grown since the Big Bang.
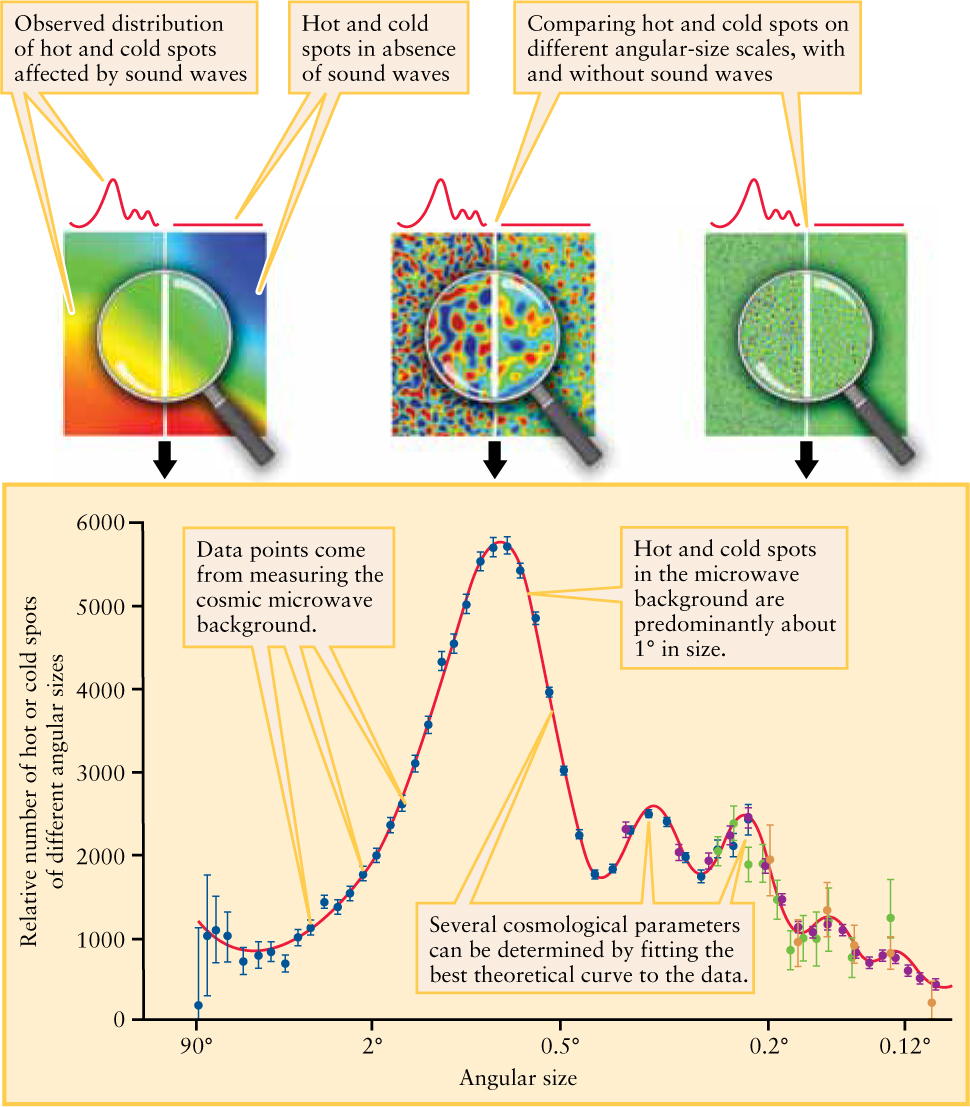
Figure 25-21 shows an important way in which astronomers systematize their data about hot and cold spots in the cosmic background radiation. This graph shows the number of observed hot or cold spots of different angular sizes, with larger spots on the left and smaller spots on the right. The presence of peaks in the graph shows that spots of certain sizes are more common than others. The largest peak tells us that the predominant angular size is about 1°, which corresponds to a region of compression or rarefaction that was about a million (106) light-years across at the time of recombination at z = 1100. (By contrast, the compressions and rarefactions in the sound waves most used in speech are a few meters across.) Since then the universe has expanded by a factor of about 1100, so that same region is now about a billion (109) light-years across.
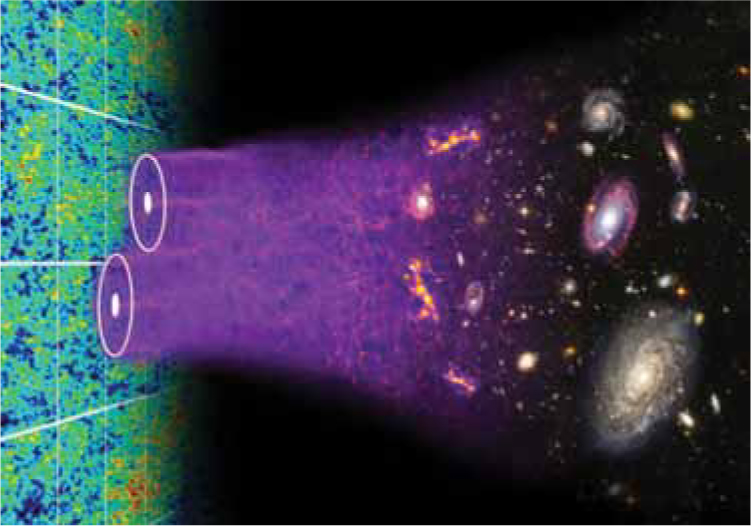
The peaks in Figure 25-21 tell us the size scales that matter formed into clumps, and these over-dense regions were the seeds of structure formation. As predicted, we see the imprint of these early sound waves in today’s distribution of mass. Figure 25-22 illustrates this evolution from variations in the CMB to the distribution of galaxies.
Different cosmological models predict different shapes for the curve shown in Figure 25-21. Astronomers determine the best model by seeing which one gives a curve that best fits the data points. For example, the peak of the curve at an angular size of 1° is just what would be expected for a flat universe with Ω0 = 1. It should be emphasized that Figure 25-21 represents an enormous success for Big Bang cosmology in making detailed predictions, matched by observations, for features covering the entire sky—some only fractions of a degree wide and others covering tens of degrees. By fitting detailed models to the CMB data, the temperature fluctuations reveal the Hubble constant, the combined (total) energy density parameter, the ordinary matter density, and the dark energy density. Table 25-2 summarizes the results of a flat-universe model that yields the particular curve shown in Figure 25-21.
| Quantity | Significance | Value* |
|---|---|---|
| Hubble constant, H0 | Present-day expansion rate of the universe |
 km/s/Mpc
 |
| Density parameter, Ω0 | Combined mass density of all forms of matter and energy in the universe divided by the critical density | 1.02 ± 0.02 |
| Matter density parameter, Ωm | Combined mass density of all forms of matter in the universe, divided by the critical density | 0.241 ± 0.034 |
| Density parameter for ordinary matter, Ωb | Mass density of ordinary atomic matter in the universe divided by the critical density | 0.0416 ± 0.001 |
| Dark energy density parameter, ΩΛ | Mass density of dark energy in the universe divided by the critical density | 0.759 ± 0.034 |
| Age of the universe, T0 | Elapsed time from the Big Bang to the present day |
 × 1010 years
 |
| Age of the universe at the time of recombination | Elapsed time from the Big Bang to when the universe became transparent, releasing the cosmic background radiation |
 × 105 years
 |
| Redshift z at the time of recombination | Since the cosmic background radiation was released, the universe has expanded by a factor 1 + z | 1089 ± 1 |
| *Values for H0, Ωm, Ωb, and T0 are based on the three-year WMAP data with the assumption of a flat universe. Values for the time and redshift of recombination and for Ω0 are from the first-year WMAP data. (NASA/WMAP Science Team) | ||
745
Our understanding of the universe as a whole has increased tremendously over the past several years. We have found compelling evidence that dark energy exists and that it is the dominant form of energy in the universe. Studies of supernovae, galaxy clusters, and the cosmic background radiation have provided us with so much high-quality data that we can now express the key parameters of the universe (Table 25-2) with very high accuracy. When we look back to the situation in the 1980s, when the value of the Hubble constant was uncertain by at least 50%, it is no exaggeration to say that we have entered an age of precision cosmology.
746
Yet many questions remain unanswered. What is the nature of dark matter? What actually is dark energy? Together, the unknown nature of dark matter and dark energy indicate that we do not understand about 96% of the energy content in our universe. Can either of these mysterious entities be detected and studied in the laboratory? These and other questions will continue to occupy cosmologists for many years to come.
CONCEPT CHECK 25-15
Consider Figure 25-21. The colorful pictures along the top compare how temperature fluctuations appear in the presence of sound waves with how they would appear in the absence of sound waves. On what size scale are the temperature fluctuations most affected by the presence of sound waves in the early universe?
CALCULATION CHECK 25-4
Consult Table 25-2. What percent of the energy content of the universe comes from ordinary matter (such as the matter making planets and stars)? What percent comes from dark energy?