5-6 Each chemical element produces its own unique set of spectral lines
Spectroscopy is the key to determining the chemical composition of planets and stars
In 1814 the German master optician Joseph von Fraunhofer repeated the classic experiment of shining a beam of sunlight through a prism (see Figure 5-3). But this time Fraunhofer subjected the resulting rainbow-colored spectrum to intense magnification. To his surprise, he discovered that the solar spectrum contains hundreds of fine, dark lines, now called spectral lines (Figure 5-14). A dark spectral line arises when light at a specific wavelength is at least partially absorbed so that the spectrum appears darker; it is also called an absorption line. By contrast, if the light from a perfect blackbody were sent through a prism, it would produce a smooth, continuous spectrum with no dark lines. Fraunhofer counted more than 600 dark lines in the Sun’s spectrum; today we know of more than 30,000. The photograph of the Sun’s spectrum in Figure 5-14 shows hundreds of these spectral lines.
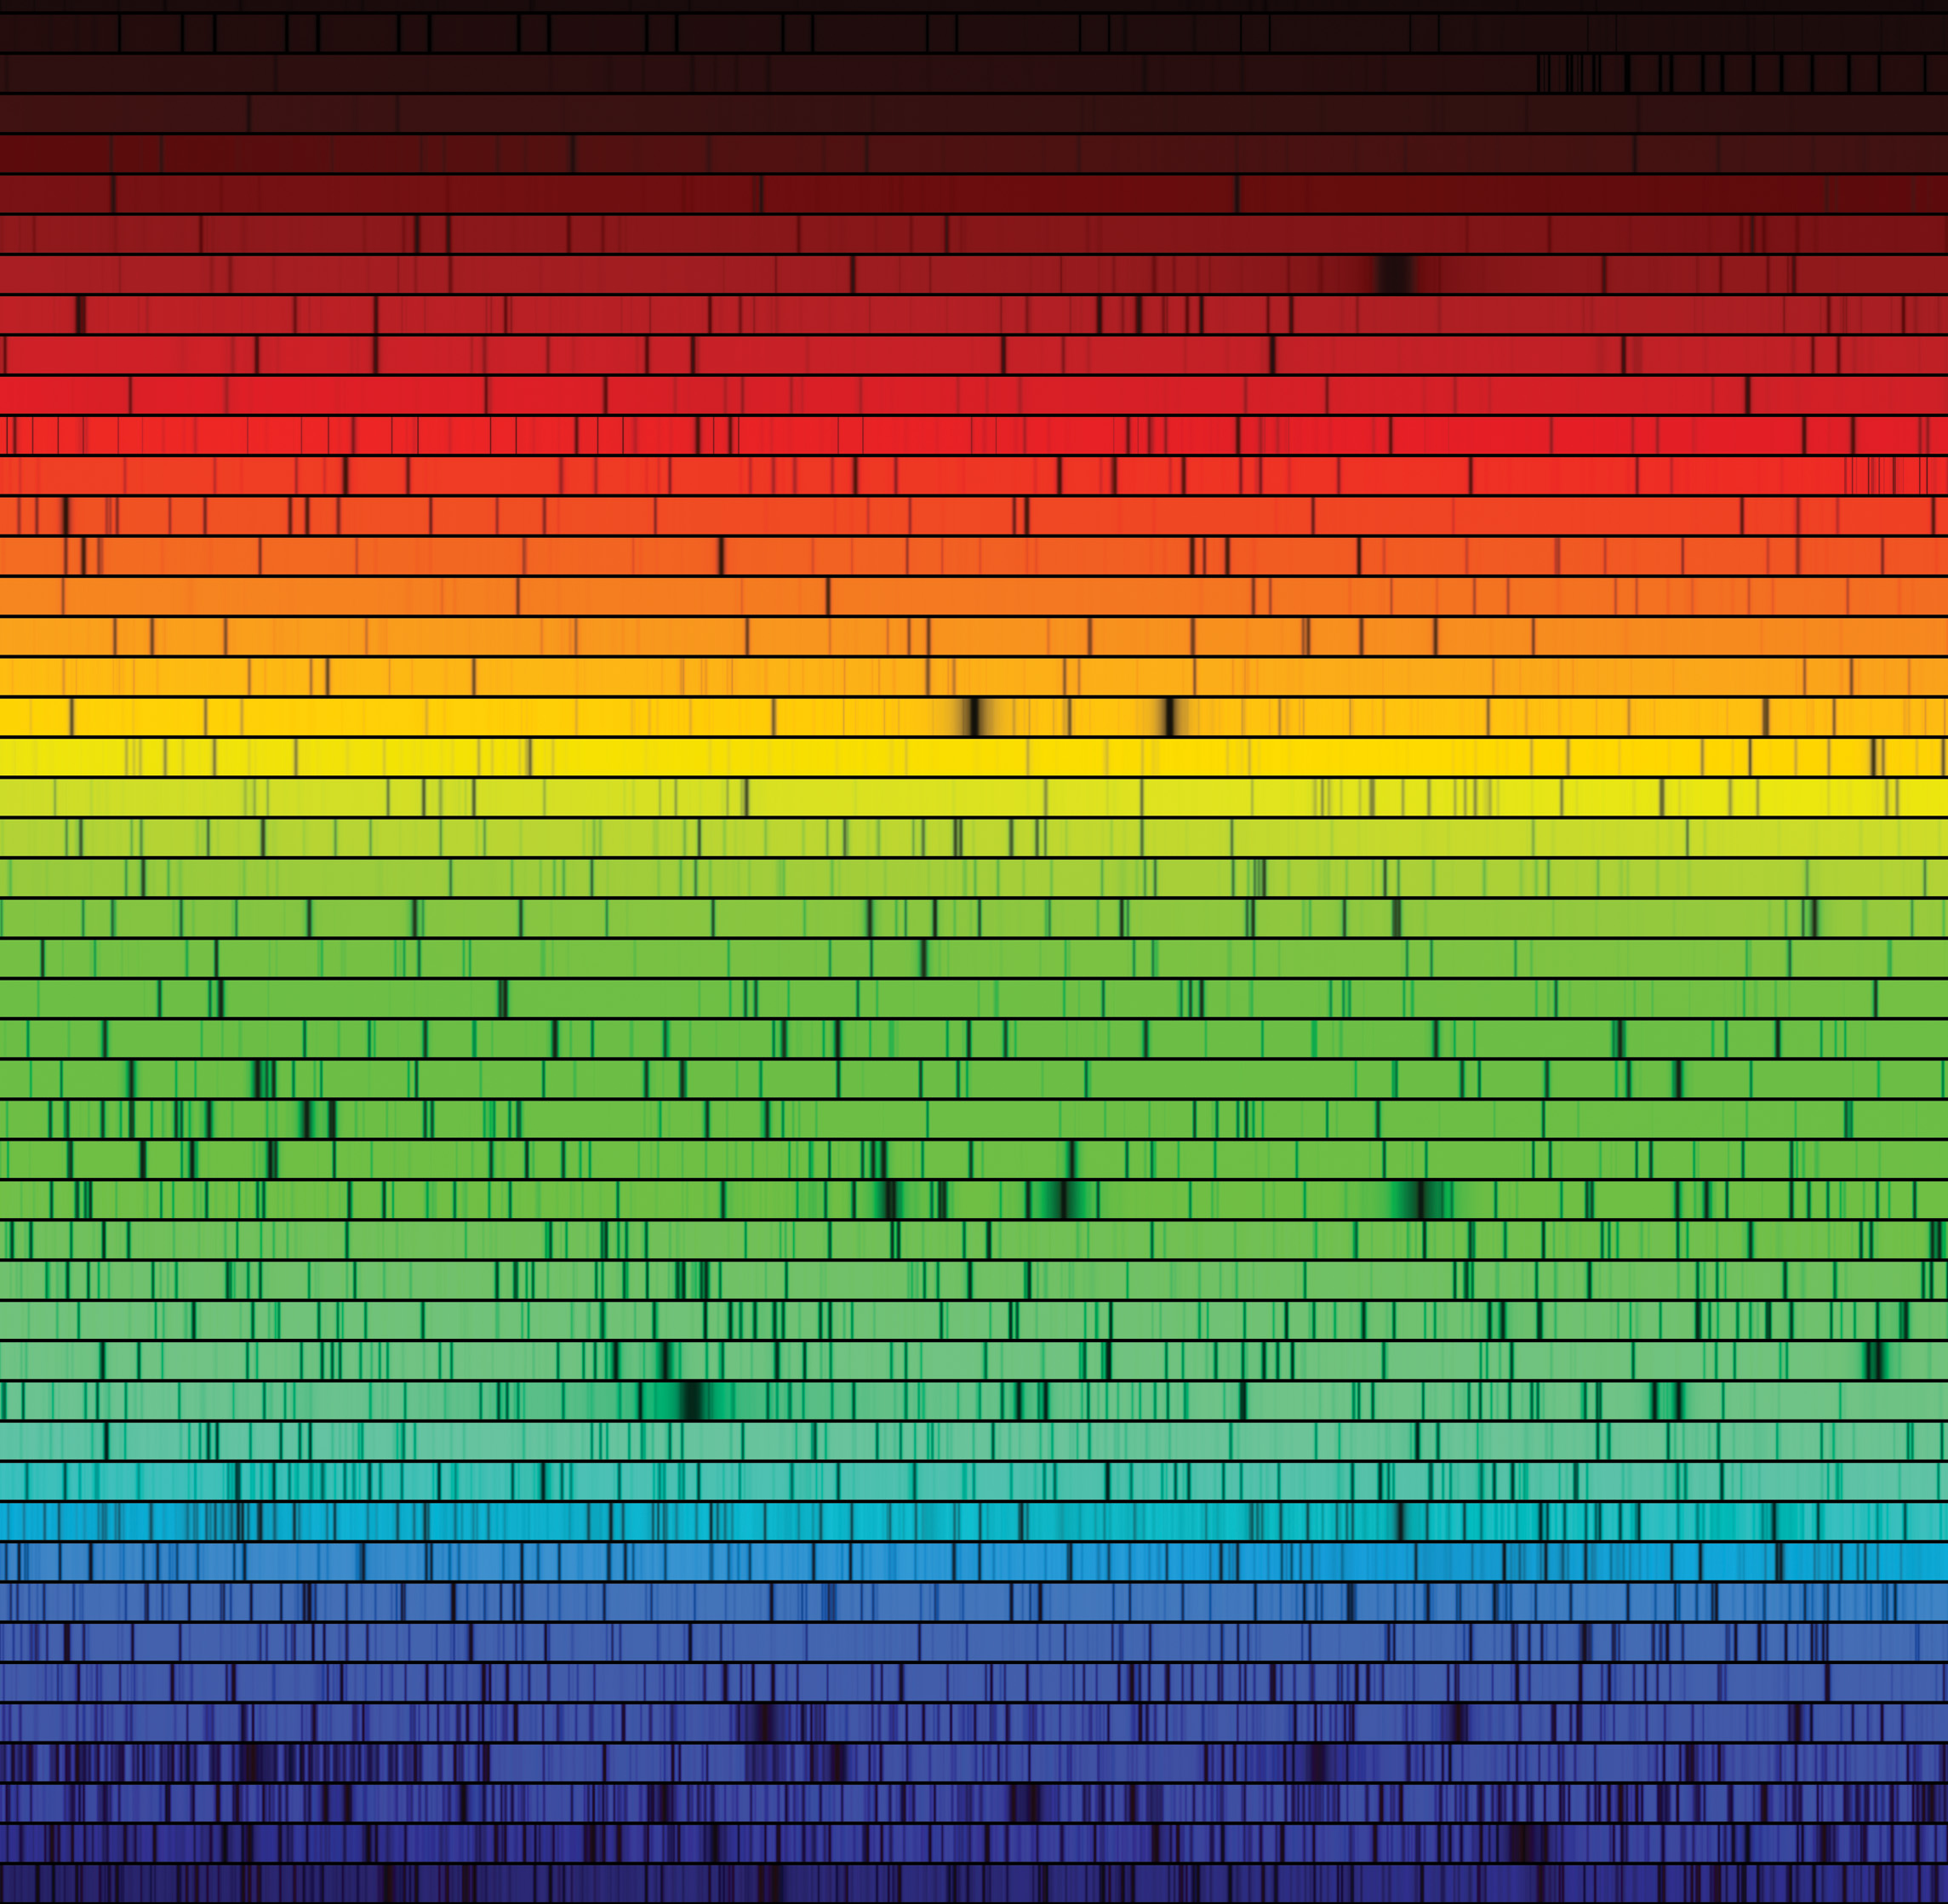
The Sun’s Spectrum Numerous dark spectral lines are seen in this image of the Sun’s spectrum. The spectrum is spread out so much that it had to be cut into segments to fit on this page.
Spectral Analysis
Half a century later, chemists discovered that they could produce spectral lines in the laboratory and use these spectral lines to analyze what kinds of atoms different substances are made of. Chemists had long known that many substances emit distinctive colors when sprinkled into a flame. To facilitate study of these colors, around 1857 the German chemist Robert Bunsen invented a gas burner (today called a Bunsen burner) that produces a clean flame with no color of its own. Bunsen’s colleague, the Prussian-born physicist Gustav Kirchhoff, suggested that the colored light produced when substances were added to the flame might best be studied by passing the resulting light through a prism (Figure 5-15). The two scientists promptly discovered that the spectrum from the flame consists of a pattern of thin, bright spectral lines against a dark background. A bright spectral line arises because at least some additional light is being emitted at a specific wavelength; it is also called an emission line.
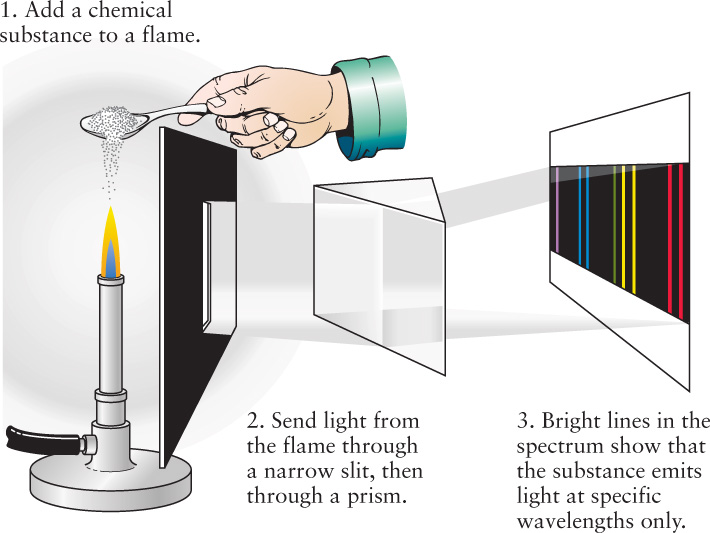
Kirchhoff and Bunsen then found that each chemical element produces its own unique pattern of spectral lines. Thus was born in 1859 the technique of spectral analysis: the identification of atoms and molecules by their unique patterns of spectral lines.
Atoms are the building blocks of substances on Earth and throughout the universe. Familiar examples are hydrogen, oxygen, carbon, iron, and gold. These atoms are also called chemical elements because a pure substance made from only one type of atom (such as pure gold) cannot be broken down into more basic chemicals. After Kirchhoff and Bunsen had recorded the prominent spectral lines of all the then-known elements, they soon began to discover other spectral lines in the spectra of vaporized mineral samples. In this way they discovered elements on Earth that had never been seen or inferred through any method.
122
Spectral analysis even allowed the discovery of new elements outside Earth. During the solar eclipse of 1868, astronomers found a new spectral line in light coming from the hot gases at the upper surface of the Sun while the main body of the Sun was hidden by the Moon. This line was attributed to a new element that was named helium (from the Greek helios, meaning “sun”). It took almost another 30 years to discover helium on Earth!
Atoms can also combine to form molecules. For example, two hydrogen atoms (symbol H) can combine with an oxygen atom (symbol O) to form a water molecule (symbol H2O). Substances like water whose molecules include atoms of different elements are called compounds. Just as each type of atom has its own unique spectrum, so does each type of molecule. Figure 5-16 shows the spectra of several types of atoms and molecules. You can easily see in Figure 5-16 that each substance produces a unique pattern of spectral lines; each pattern can be thought of as a spectral “fingerprint” for identification. This is enormously important in astronomy because it allows us to determine the detailed composition of distant planets and stars by analyzing the spectra of their light that reaches Earth.
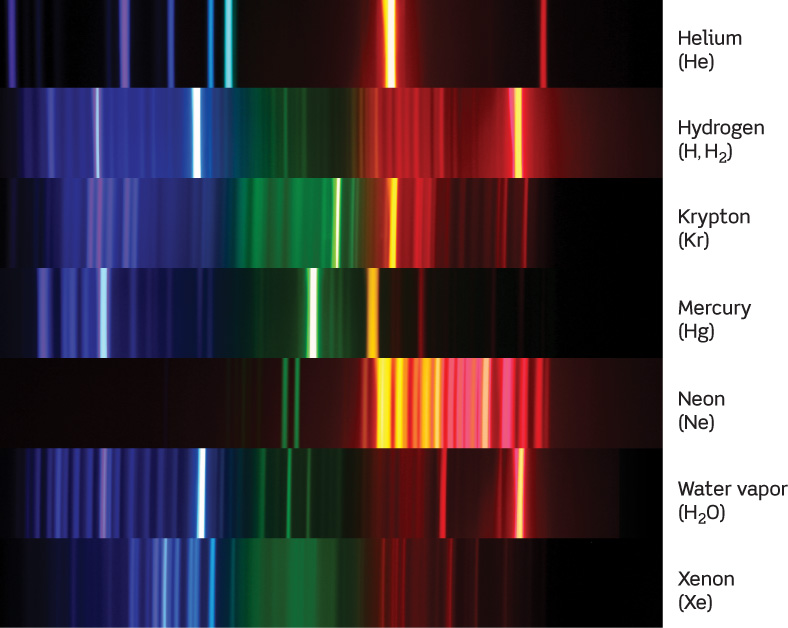
Various Spectra These photographs show the spectra of different types of gases as measured in a laboratory on Earth. Each type of gas has a unique spectrum that is the same wherever in the universe the gas is found. Water vapor (H2O) is a compound whose molecules are made up of hydrogen and oxygen atoms; the hydrogen molecule (H2) is made up of two hydrogen atoms. For the hydrogen gas lamp, the bright lines are from single hydrogen atoms (H), and the fainter lines are emitted from hydrogen molecules (H2).
Kirchhoff’s Laws
 The spectrum of the Sun, with its dark spectral lines superimposed on a bright background (see Figure 5-14), may seem to be unrelated to the spectra of bright lines against a dark background produced by substances in a flame (see Figure 5-15). But by the early 1860s, Kirchhoff’s experiments had revealed a direct connection between these two types of spectra. His conclusions are summarized in three important statements about spectra that are today called Kirchhoff’s laws. These laws, which are illustrated in Figure 5-17, are as follows:
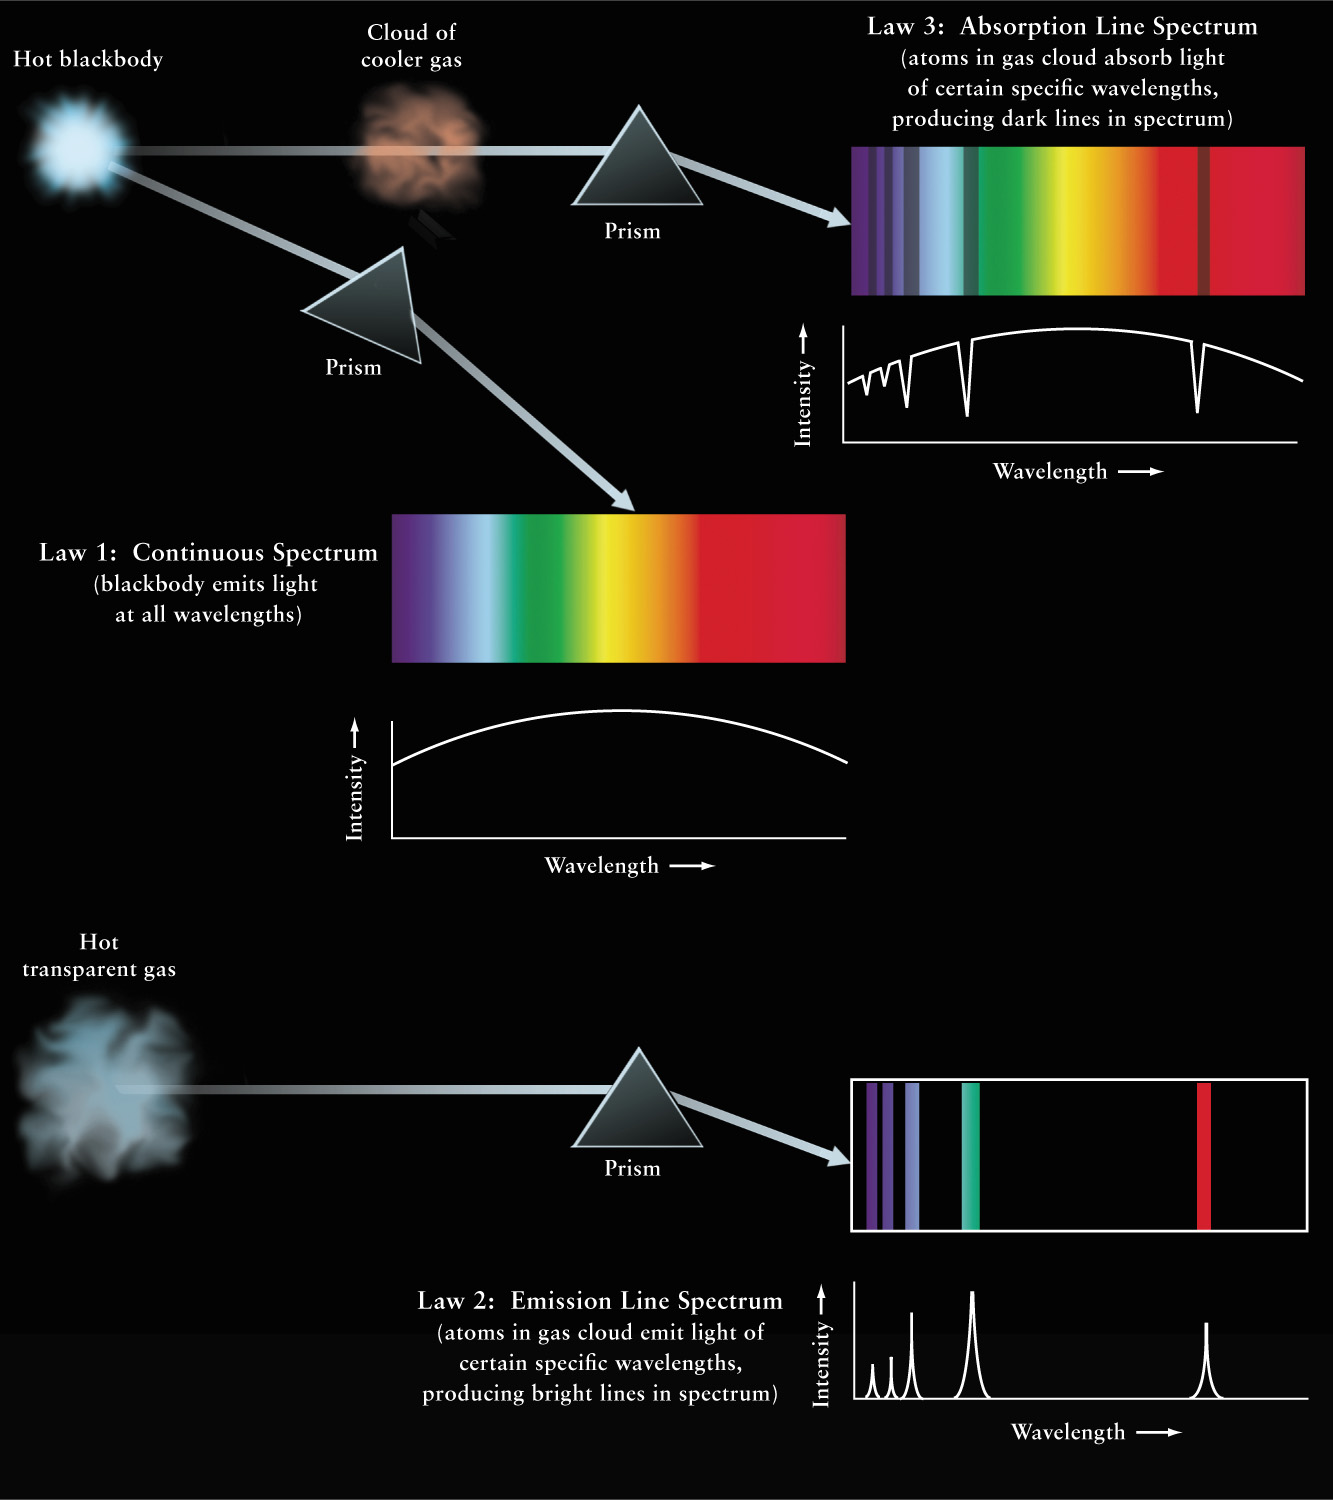
 Kirchhoff’s Laws for Continuous, Absorption Line, and Emission Line Spectra Law 1: A hot, opaque body emits a continuous spectrum of light. Law 3: If this light is passed through a cloud of a cooler gas, the cloud absorbs light of certain specific wavelengths, leaving the light that passes directly through the cloud with an absorption line spectrum. Law 2: Atoms in a hot gas cloud collide energetically and emit light, creating an emission line spectrum that is unique to each type of atom. In each case the spectra is shown, as it would appear with a prism, and just below it, by a graph of intensity versus wavelength.
- Law 1 A hot opaque body, such as a perfect blackbody, or a hot, dense gas produces a continuous spectrum—a complete rainbow of colors without any spectral lines.
- Law 2 A hot, transparent gas produces an emission line spectrum—a series of bright spectral lines against a dark background.
- Law 3 A cool, transparent gas in front of a source of a continuous spectrum produces an absorption line spectrum—a series of dark spectral lines among the colors of the continuous spectrum. Furthermore, the dark lines in the absorption spectrum of a particular gas occur at exactly the same wavelengths as the bright lines in the emission spectrum of that same gas. As we will see in Section 5-8, absorption and emission lines correspond to distinct changes in an electron’s orbit within an atom.
CAUTION!
Figure 5-17 shows that light can either pass through a cloud of gas or be absorbed by the gas. But there is also a third possibility: The light can simply bounce off the atoms or molecules that make up the gas, a phenomenon called light scattering. In other words, photons passing through a gas cloud can miss the gas atoms altogether, be swallowed whole by the atoms (absorption), or bounce off the atoms like billiard balls colliding (scattering). Box 5-4 describes how light scattering explains the blue color of the sky and the red color of sunsets.
In general, a gas cloud can both emit and absorb light. Whether an emission line spectrum or an absorption line spectrum is observed from an intervening gas cloud depends on the relative temperatures of the gas cloud and its background. Absorption lines are seen if the background is hotter than the gas, and emission lines are seen if the background is cooler. This is why the gas cloud illustrating absorption (Law 3) in Figure 5-17 is cooler than the star.
Spectroscopy
Spectroscopy is the systematic study of spectra and spectral lines. As noted, spectral lines are tremendously important in astronomy, because they provide detailed evidence about the chemical composition of distant objects. As an example, the spectrum of the Sun shown in Figure 5-14 is an absorption line spectrum. The continuous spectrum comes from the hot surface of the Sun, which acts like a blackbody. The dark absorption lines are caused by this light passing through a cooler gas; this gas is the atmosphere that surrounds the Sun. Therefore, by identifying the spectral lines present in the solar spectrum, we can determine the chemical composition of the Sun’s atmosphere.
123
124
ASTRONOMY DOWN TO EARTH
Why the Sky Is Blue
Light scattering is a process where photons bounce off particles, and change their direction of travel. The scattering particles can be atoms, molecules, or clumps of molecules. When you see regular objects like rocks or trees that do not produce their own intrinsic light, you see them because they scatter sunlight into your eyes.
An important fact about light scattering is that very small particles—ones that are smaller than a wavelength of visible light—are quite effective at scattering short-wavelength photons of blue light but less effective at scattering long-wavelength photons of red light. This fact explains a number of phenomena that you can see here on Earth.
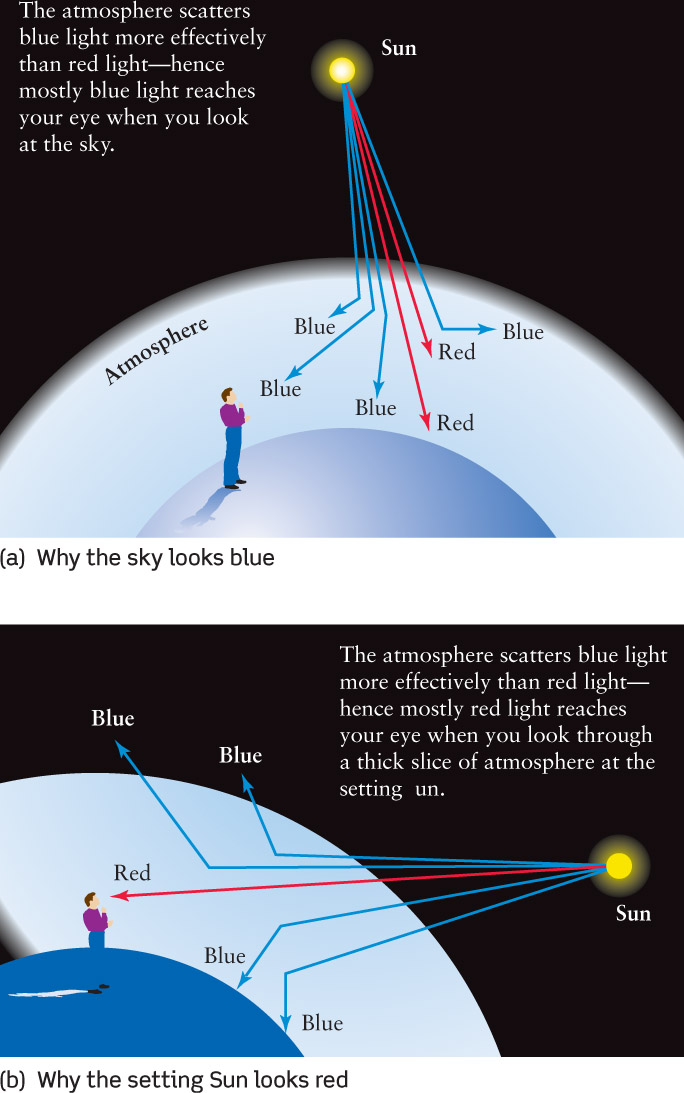
The light that comes from the daytime sky is sunlight that has been scattered by the molecules that make up our atmosphere (see part a of the accompanying figure). Air molecules are less than 1 nm across, far smaller than the wavelength of visible light, so they scatter blue light more than red light—which is why the sky looks blue. In other words, the sky is blue because while incoming white sunlight contains all the colors, air molecules scatter blue light around more than red light, literally spreading blue light all throughout the atmosphere.
During the day, distant mountains often appear blue thanks to sunlight being scattered from the atmosphere between the mountains and your eyes. (The Blue Ridge Mountains, which extend from Pennsylvania to Georgia, and Australia’s Blue Mountains derive their names from this effect.)
Light scattering also explains why sunsets are red. Again, sunlight contains all the colors, but as this light passes through our atmosphere the blue light is scattered away from the straight-line path from the Sun. On the other hand, red light undergoes relatively little scattering, so light coming directly from the Sun looks a bit redder once some blue has been removed. When you look toward the setting Sun (but, never look at the Sun!), the sunlight that reaches your eye has had to pass through a relatively thick layer of atmosphere (part b of the accompanying figure). Hence, a large fraction of the blue light from the Sun has been scattered, and the Sun appears quite red. If, at sunset, the sunlight shines onto clouds, the clouds also look red after much of the blue light has been scattered away.
The same effect also applies to sunrises, but sunrises seldom look as red as sunsets do. The reason is that dust is lifted into the atmosphere during the day by the wind (which, being driven by sunlight, typically blows stronger in the daytime), and dust particles in the atmosphere help to scatter even more blue light.
Finally, some scattered light appears white. If the small particles that scatter light are sufficiently concentrated, there will be almost as much scattering of red light as of blue light, and the scattered light will then appear white. This can occur when the scattering comes from dense ice crystals or water vapor and explains the white color of snow, clouds, and fog.
Light scattering has many applications to astronomy. For example, it explains why very distant stars in our Galaxy appear surprisingly red. The reason is that there are tiny dust particles throughout the space between the stars, and this dust scatters blue light. By studying how much scattering takes place, astronomers have learned about the tenuous material that fills interstellar space.
125
Even when the spectral lines from more than one type of atom appear in the same spectrum, the different atoms can be identified. Figure 5-18 shows both a portion of the Sun’s absorption line spectrum, which has numerous lines, and the emission line spectrum of iron vapor over the same wavelength range, measured on Earth. This pattern of bright spectral lines in the lower spectrum is iron’s own distinctive “fingerprint,” which no other substance can imitate. Because some absorption lines in the Sun’s spectrum coincide with the iron lines, some vaporized iron must exist in the Sun’s atmosphere.

Iron in the Sun The upper part of this figure is a portion of the Sun’s spectrum at violet wavelengths, showing numerous dark absorption lines. The lower part of the figure is a corresponding portion of the emission line spectrum of vaporized iron. The iron lines coincide with some of the solar lines, which proves that there is some iron (albeit a relatively small amount) in the Sun’s atmosphere.
Spectroscopy can also help us analyze gas clouds in space, such as the nebula surrounding the star cluster NGC 346 shown in Figure 5-19. The particular shade of red that dominates the color of this nebula is due to an emission line at a wavelength of 656 nm. This is one of the characteristic wavelengths emitted by hydrogen gas, so we can conclude that this nebula contains hydrogen. More detailed analyses of this kind show that hydrogen is the most common element in gaseous nebulae, and indeed in the universe as a whole. The spectra of other nebulae, such as the Ring Nebula shown in the image that opens this chapter, also reveal the presence of nitrogen, oxygen, helium, and other gases.
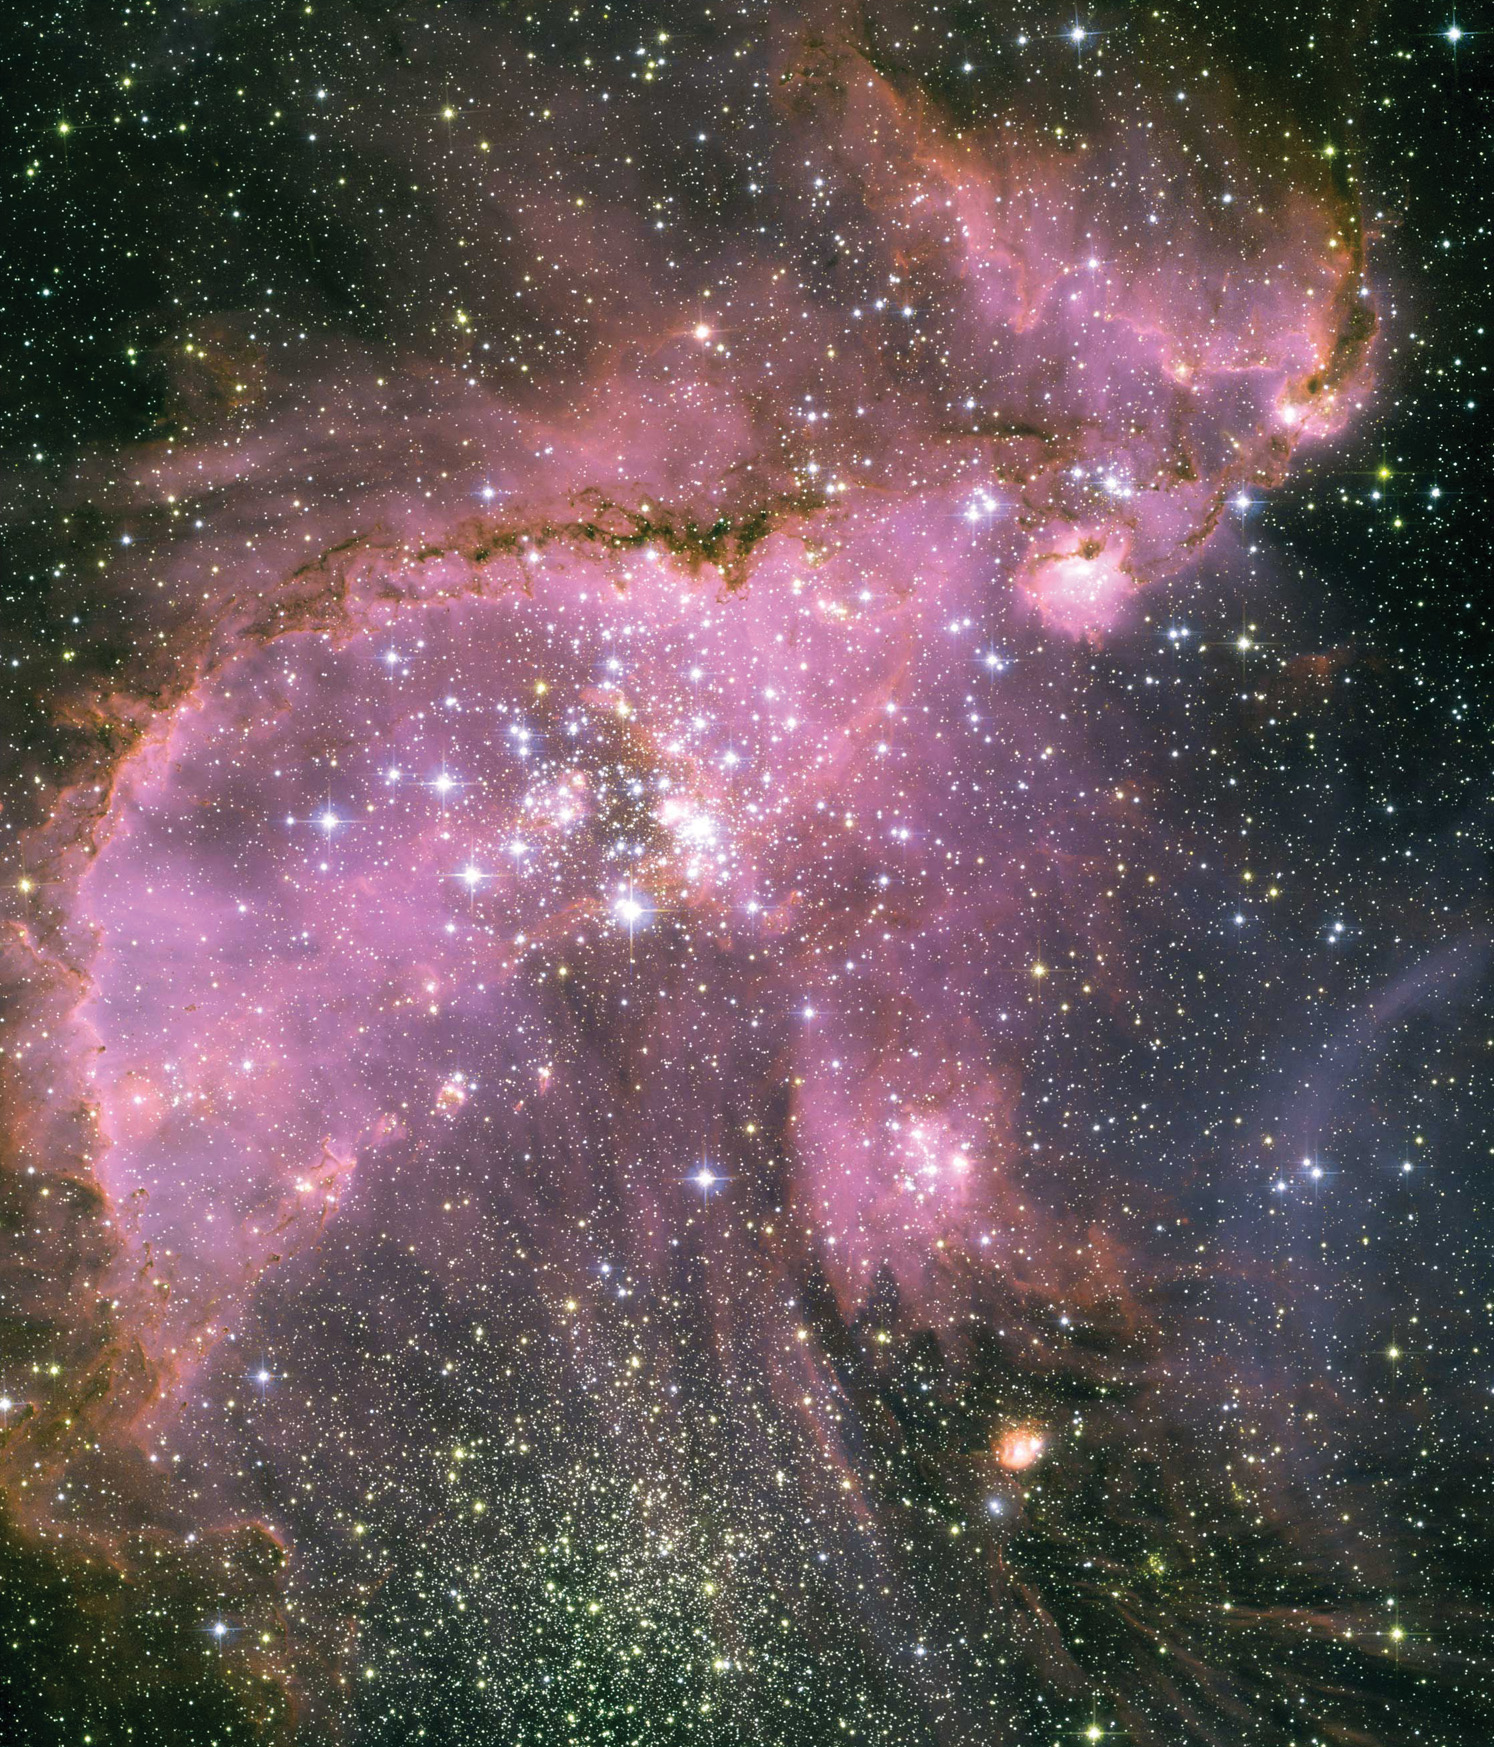
Analyzing the Composition of a Distant Nebula The glowing gas cloud in this Hubble Space Telescope image lies 210,000 light-years away in the constellation Tucana (the Toucan). The red light emitted by the nebula has a wavelength of 656 nm, characteristic of an emission line from hydrogen gas. Hot stars within the nebula emit high energy, ultra violet photons, which ionize hydrogen (removing the electron). When the electron returns to the atom, it jumps towards the center and gives off emission lines.
What is truly remarkable about spectroscopy is that it can determine chemical composition at any distance. The 656-nm red light produced by a sample of heated hydrogen gas on Earth (the bright red line in the hydrogen spectrum in Figure 5-16) is the same as that observed coming from the nebula shown in Figure 5-19, located about 210,000 light-years away. Throughout this book we will see many examples of how astronomers use spectra to determine the nature of celestial objects.
Why does an atom absorb light of only particular wavelengths? And why does it then emit light of only these same wavelengths? Maxwell’s theory of electromagnetism (see Section 5-2) could not answer these questions. The answers did not come until scientists began to discover the structure and properties of atoms.
CONCEPT CHECK 5-10
Which one of Kirchhoff’s laws describes the Sun’s spectrum in Figure 5-14? If helium gas is heated up enough to give the spectrum at the top of Figure 5-16, which of Kirchhoff’s laws applies?
CONCEPT CHECK 5-11
What type of spectra would result from a glowing field of hot, dense lava as viewed by an orbiting satellite through Earth’s atmosphere?
126