5-8 Spectral lines are produced when an electron jumps from one energy level to another within an atom
Niels Bohr explained spectral lines with a radical new model of the atom
Niels Bohr began his study of the connection between atomic spectra and atomic structure by trying to understand the structure of hydrogen, the simplest and lightest of the elements. (As we discussed in Section 5-6, hydrogen is also the most common element in the universe.) When Bohr was done, he had not only found a way to explain this atom’s spectrum but had also found a justification for Kirchhoff’s laws in terms of atomic physics.
Hydrogen and the Balmer Series
The most common type of hydrogen atom consists of a single electron and a single proton. Hydrogen atoms have a simple visible-light spectrum consisting of a pattern of lines that begins at a wavelength of 656.3 nm and ends at 364.6 nm. The first spectral line is called Hα (H-alpha), the second spectral line is called Hβ (H-beta), the third is Hγ (H-gamma), and so forth (Figure 5-21). (These are the bright lines in the spectrum of hydrogen shown in Figure 5-16. The fainter lines between these appear when hydrogen atoms form into molecules.) The closer you get to the short-wavelength end of the spectrum at 364.6 nm, the more spectral lines you see.

Balmer Lines in the Spectrum of a Star This portion of the spectrum of the star Vega in the constellation Lyra (the Harp) shows eight Balmer lines, from Hα at 656.3 nm through Hθ (H-theta) at 388.9 nm. The series converges at 364.6 nm, slightly to the left of Hθ. Parts of this image were made using ultraviolet radiation, which is indicated by the highlighted U in the wavelength tab.
The regularity in this spectral pattern was described mathematically in 1885 by Johann Jakob Balmer, a Swiss schoolteacher. In Figure 5-21, the spectral lines of hydrogen at visible wavelengths are today called Balmer lines, and the entire pattern from Hα onward is called the Balmer series. Stars in general, including the Sun, have Balmer absorption lines in their spectra, which shows they have atmospheres that contain hydrogen. Notice that the Hα line in Figure 5-21 is in the red portion of the visible spectrum, and when seen as an emission line, it accounts for much of the red seen in beautiful nebulae (including Figure 5-19).
Using trial and error, Balmer discovered a formula from which the wavelengths (λ) of hydrogen’s spectral lines can be calculated. Balmer’s formula is usually written
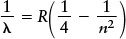
In this formula R is the Rydberg constant (R = 1.097 × 10⁷ m−1), named in honor of the Swedish spectroscopist Johannes Rydberg, and n can be any integer (whole number) greater than 2. The meaning of n will become clear shortly when we discuss electron orbits in the hydrogen atom. To get the wavelength λα of the spectral line Hα, you first put n = 3 into Balmer’s formula:

Then take the reciprocal:

To get the wavelength of Hβ, use n = 4, and to get the wavelength of Hγ use n = 5. If you use n = ∞ (the symbol ∞ stands for infinity), you get the short-wavelength end of the hydrogen spectrum at 364.6 nm. (Note that 1 divided by infinity equals zero.)
Bohr’s Model of Hydrogen
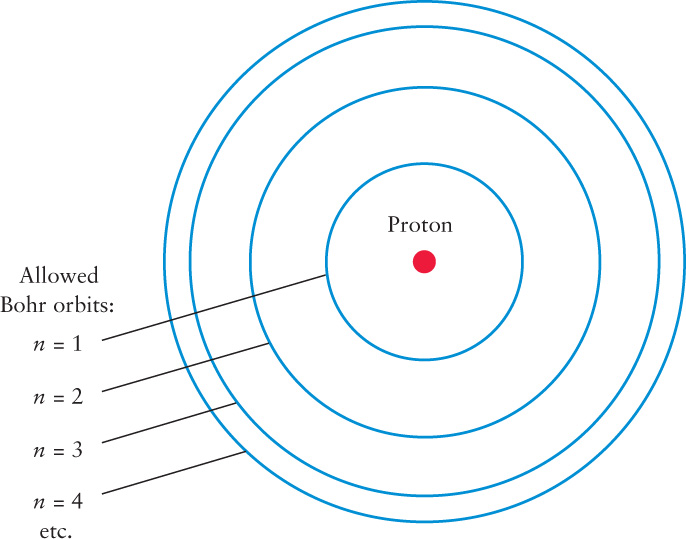
Bohr realized that to fully understand the structure of the hydrogen atom, he had to be able to derive Balmer’s formula using the laws of physics. He first made the rather wild assumption that the electron in a hydrogen atom can orbit the nucleus only in certain specific orbits. (This idea was a significant break with the ideas of Newton, in whose mechanics any orbit should be possible.) Figure 5-22 shows the four smallest of these Bohr orbits, labeled by the numbers n = 1, n = 2, n = 3, and so on.
Although confined to one of these allowed orbits while circling the nucleus, an electron can jump from one Bohr orbit to another. For an electron to jump between orbits, the hydrogen atom must gain or lose a specific amount of energy.
An atom must absorb energy for the electron to go from an inner to an outer orbit; an atom must release energy for the electron to go from an outer to an inner orbit.
129
As an example, Figure 5-23 shows an electron jumping between the n = 2 and n = 3 orbits of a hydrogen atom as the atom absorbs or emits an Hα photon. Figure 5-23 shows absorption and emission of a single photon, but in a gas with many atoms, these same jumps produce absorption lines and emission lines.
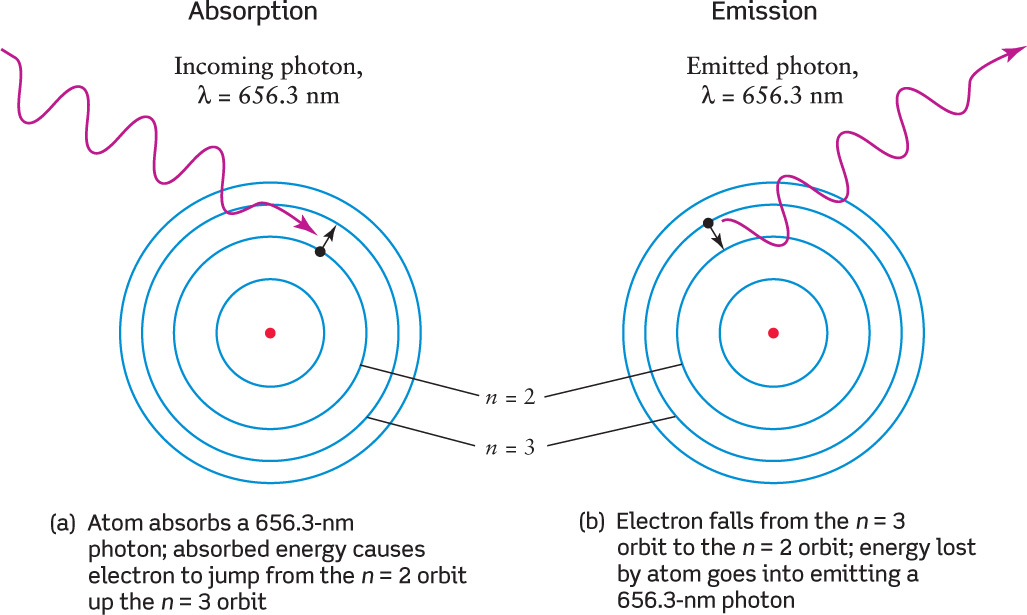
 The Absorption and Emission of an Hα Photon This schematic diagram, drawn according to the Bohr model, shows what happens when a hydrogen atom (a) absorbs or (b) emits a photon whose wavelength is 656.3 nm.
Bohr’s orbital model also explains Kirchhoff’s observation (see Figure 5-17) that an atom can show the same spectral lines as either emission or absorption. Here’s why: When the electron jumps from one orbit to another, the energy of the photon that is emitted or absorbed equals the difference in energy between these two orbits. This energy difference, and hence the photon energy, is the same whether the jump is from a low orbit to a high orbit (Figure 5-23a) or from the high orbit back to the low one (Figure 5-23b). If two photons have the same energy E, the relationship E = hc/λ tells us that they must also have the same wavelength λ. Therefore, if an atom can emit photons of a given energy and wavelength, it can also absorb photons of precisely the same energy and wavelength.
The Bohr picture also helps us visualize how a hot, transparent gas produces an emission line spectrum (Kirchhoff’s Law 2). When a gas is heated, its atoms move around rapidly and can collide forcefully with each other. These energetic collisions excite the atoms’ electrons into various high orbits. The electrons then cascade back down to the innermost possible orbit, emitting photons whose energies are equal to the energy differences between different Bohr orbits. In this fashion, a hot gas produces an emission line spectrum with a variety of different wavelengths.
To produce an absorption line spectrum (Kirchhoff’s Law 3), begin with a relatively cool gas, so that the electrons in most of the atoms are in inner, low-energy orbits. If a beam of light with a continuous spectrum is shone through the gas, most wavelengths will pass through undisturbed. Only those photons will be absorbed whose energies are just right to excite an electron to an allowed outer orbit. Hence, only certain wavelengths will be absorbed, and dark lines will appear in the spectrum at those wavelengths.
130
Using his picture of allowed orbits and the formula E = hc/λ, Bohr was able to prove mathematically that the wavelength λ of the photon emitted or absorbed as an electron jumps between an inner orbit N and an outer orbit n is
Bohr formula for hydrogen wavelengths
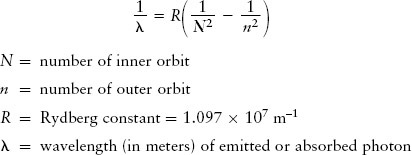
If Bohr let N = 2 for the inner orbit in this formula, he got back the formula that Balmer discovered by trial and error. Hence, Bohr deduced the meaning of the Balmer series: All the Balmer lines are produced by electrons jumping between the second Bohr orbit (N = 2) and higher orbits (n = 3, 4, 5, and so on).
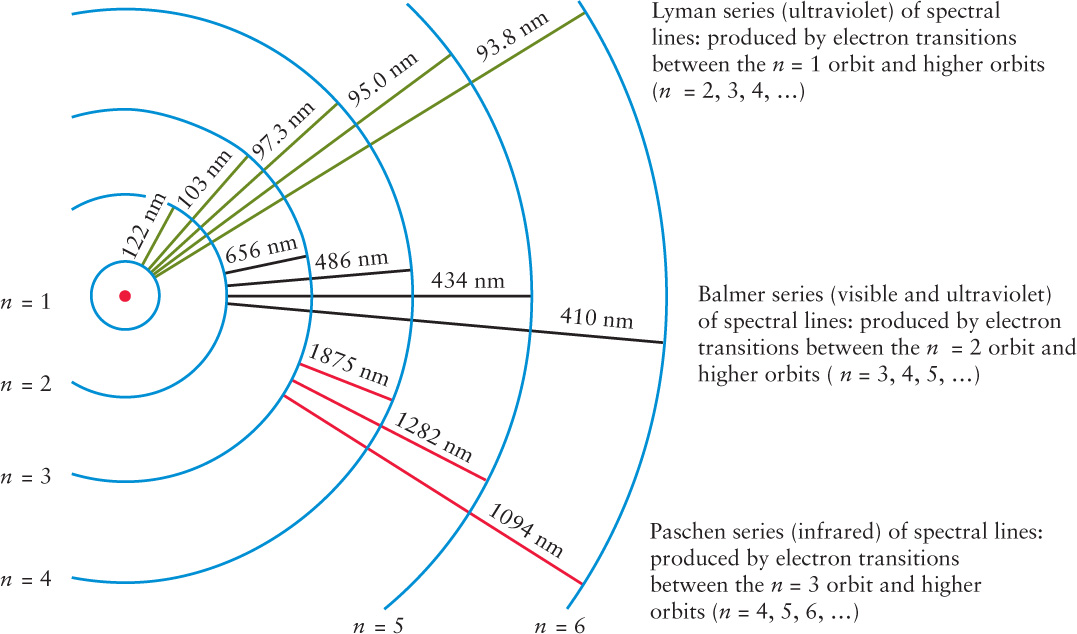
Bohr’s formula also correctly predicts the wavelengths of other series of spectral lines that occur at nonvisible wavelengths (Figure 5-24). Using N = 1 for the inner orbit gives the Lyman series, which is entirely in the ultraviolet. All the spectral lines in this series involve electron transitions between the lowest Bohr orbit and all higher orbits (n = 2, 3, 4, and so on). This pattern of spectral lines begins with Lα (Lyman alpha) at 122 nm and converges on L∞ at 91.2 nm. Using N = 3 gives a series of infrared wavelengths called the Paschen series. This series, which involves transitions between the third Bohr orbit and all higher orbits, begins with Pα (Paschen alpha) at 1875 nm and converges on P∞ at 822 nm. Additional series exist at still longer wavelengths.
Atomic Energy Levels
Today’s view of the atom owes much to the Bohr model, but is different in certain ways. The modern picture is based on quantum mechanics, a branch of physics developed during the 1920s that deals with photons and subatomic particles. As a result of this work, physicists no longer picture electrons as moving in specific orbits about the nucleus. Instead, electrons are now known to have both particle and wave properties and are said to occupy only certain energy levels in the atom.
An extremely useful way of displaying the structure of an atom is with an energy-level diagram shows such a diagram for hydrogen. The lowest energy level, called the ground state, corresponds to the n = 1 Bohr orbit. Higher energy levels, called excited states, correspond to successively larger Bohr orbits.
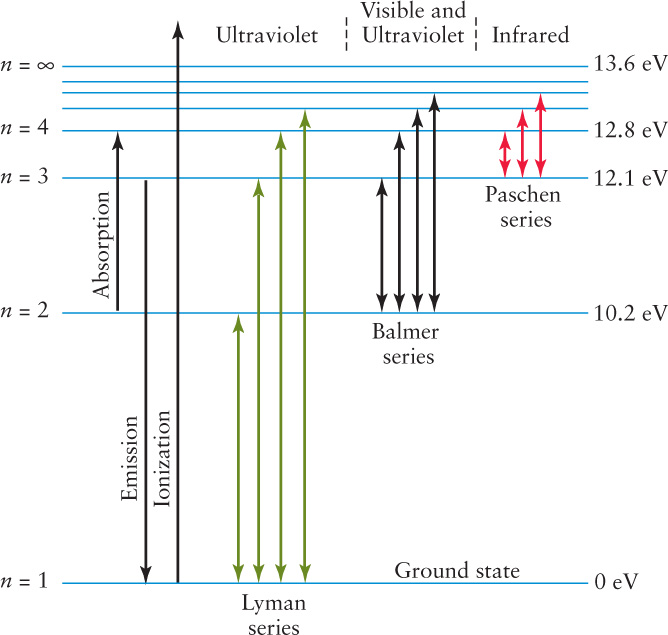
An electron can jump from the ground state (n = 1) up to the n = 2 level if the atom absorbs a Lyman-alpha photon with a wavelength of 122 nm. Such a photon has energy E = hc/λ = 10.2 eV (electron volts; see Section 5-5). That is why the energy level of n = 2 is shown in Figure 5-25 as having an energy 10.2 eV above that of the ground state (which is usually assigned a value of 0 eV). Similarly, the n = 3 level is 12.1 eV above the ground state, and so forth. Electrons can make transitions to higher energy levels by absorbing a photon or in a collision between atoms; they can make transitions to lower energy levels by emitting a photon.
131
On the energy-level diagram for hydrogen, the n = ∞ level has an energy of 13.6 eV. (This corresponds to an infinitely large “orbit” in the Bohr model.) If the electron is initially in the ground state and the atom absorbs a photon of any energy greater than 13.6 eV, the electron will be removed completely from the atom. This process is called ionization. A 13.6-eV photon has a wavelength of 91.2 nm, equal to the shortest wavelength in the ultraviolet Lyman series (L∞). So any photon with a wavelength of 91.2 nm or less can ionize hydrogen. (Recall that the Planck formula E = hc/λ tells us that the shorter the wavelength, the higher the photon energy.)
As an example, the gaseous nebula shown in Figure 5-19 surrounds a cluster of hot stars that produce copious amounts of ultraviolet photons with wavelengths less than 91.2 nm. Hydrogen atoms in the nebula that absorb these photons become ionized and lose their electrons. When the electrons recombine with the nuclei, they cascade down the energy levels to the ground state and emit visible light in the process. This process is what makes the nebula glow. Note that this emission is due to the ionization of the atoms, not the temperature of the gas, and illustrates that Kirchhoff’s Law 2 is not the only way to produce an emission line spectrum.
The Spectra of Other Elements
 The same basic principles that explain the hydrogen spectrum also apply to the atoms of other elements. Electrons in each kind of atom can only be in certain energy levels, so only photons of certain wavelengths can be emitted or absorbed. Because each kind of atom has its own unique arrangement of electron energy levels, the pattern of spectral lines is likewise unique to that particular type of atom. These patterns are in general much more complicated than for the hydrogen atom.
The properties of energy levels explain the emission line spectra and absorption line spectra of gases. But what about the continuous spectra produced by dense objects like the glowing coils of a toaster or other blackbody object? These objects are made of atoms, so why don’t they emit light with an emission line spectrum characteristic of the particular atoms of which they are made?
The reason is directly related to the difference between a gas on the one hand and a liquid or solid on the other. In a gas, atoms are widely separated and can emit photons without interference from other atoms. But in a liquid or a solid, atoms are so close that they almost touch, and thus these atoms interact strongly with each other. In addition, each of the many possible interactions in a liquid or solid have their own energy levels. As a result, the pattern of distinctive bright spectral lines that the atoms would emit in isolation becomes crowded with additional lines forming a continuous spectrum.
ANALOGY
Think of atoms as being like tuning forks. If you strike a single tuning fork, it produces a sound wave with a single clear frequency and wavelength, just as an isolated atom emits light of definite wavelengths. But if you shake a box packed full of tuning forks, you will hear a clanging noise that is a mixture of sounds of all different frequencies and wavelengths. This is directly analogous to the continuous spectrum of light emitted by a dense object with closely packed atoms.
With the work of such people as Planck, Einstein, Rutherford, and Bohr, the interchange between astronomy and physics came full circle. Modern physics was born when Newton set out to understand the motions of the planets. Two and a half centuries later, physicists in their laboratories probed the properties of light and the structure of atoms. Their labors had immediate applications in astronomy. Armed with this new understanding of light and matter, astronomers were able to investigate in detail the chemical and physical properties of planets, stars, and galaxies.
CONCEPT CHECK 5-12
Two photons are emitted from a hydrogen atom. One comes from the electron jumping down from the n = 3 level to the n = 1 level. The other photon comes from an electron transition from n = 2 to n = 1. Which photon has the highest frequency?
CONCEPT CHECK 5-13
Hydrogen is, by far, the most abundant element in the universe. Are any hydrogen emission lines visible to humans? If so, what color is most common?
132