6-5 Spectrographs record the spectra of astronomical objects
The spectrum of a planet, star, or galaxy can reveal more about its nature than an image
We saw in Section 5-6 how the spectrum of an astronomical object provides a tremendous amount of information about that object, including its chemical composition and temperature. So, measuring spectra, or spectroscopy, is one of the most important uses of telescopes. Indeed, some telescopes are designed solely for measuring the spectra of distant, faint objects; they are never used for imaging.
Spectrographs and Diffraction Gratings
An essential tool of spectroscopy is the spectrograph, a device that records spectra. This optical device is mounted at the focus of a telescope. Figure 6-20a shows one design for a spectrograph, in which a diffraction grating is used to form the spectrum of a planet, star, or galaxy. A diffraction grating is a piece of glass on which thousands of very regularly spaced parallel lines have been cut. Some of the finest diffraction gratings have more than 10,000 lines per centimeter, which are usually cut by drawing a diamond back and forth across the glass. When light is shone on a diffraction grating, a spectrum is produced by the way in which light waves leaving different parts of the grating interfere with each other. (This same effect produces the rainbow of colors you see reflected from a compact disc or DVD, as shown in Figure 6-20b. Information is stored on the disc in a series of closely spaced pits, which acts as a diffraction grating.)
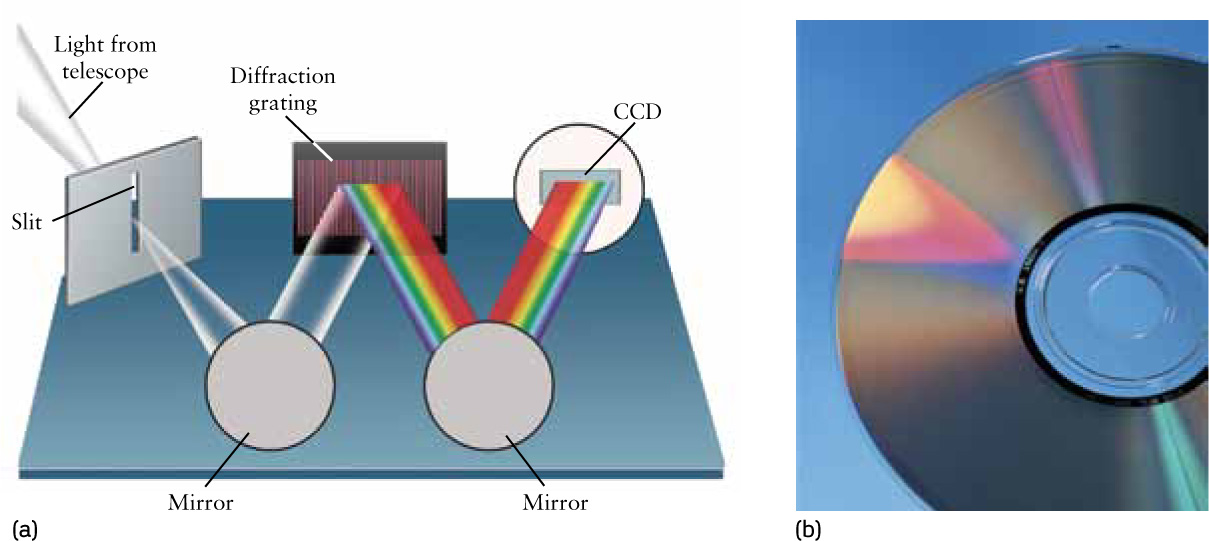
A Grating Spectrograph (a) This optical device uses a diffraction grating to break up the light from a source into a spectrum. The spectrum is then recorded on a CCD. (b) A diffraction grating has a large number of parallel lines in its surface that reflect light of different colors in different direction. A compact disc, which stores information in a series of closely spaced pits, reflects light in a similar way.
156
Older types of spectrographs used a prism rather than a diffraction grating to form a spectrum. Using a prism had several drawbacks. A prism does not disperse the colors of the rainbow evenly: Blue and violet portions of the spectrum are spread out more than the red portion. In addition, because the blue and violet wavelengths must pass through more of the prism’s glass than do the red wavelengths (examine Figure 5-3), light is absorbed unevenly across the spectrum. Indeed, a glass prism is opaque to near-ultraviolet light. For these reasons, diffraction gratings are preferred in modern spectrographs.
In Figure 6-20a the spectrum of a planet, star, or galaxy formed by the diffraction grating is recorded on a CCD. Light from a hot gas (such as helium, neon, argon, iron, or a combination of these) is then focused on the spectrograph slit. The result is a comparison spectrum alongside the spectrum of the celestial object under study. The wavelengths of the bright spectral lines of the comparison spectrum are known from laboratory experiments and can therefore serve as reference markers. (See Figure 5-18, which shows the spectrum of the Sun and a comparison spectrum of iron.)
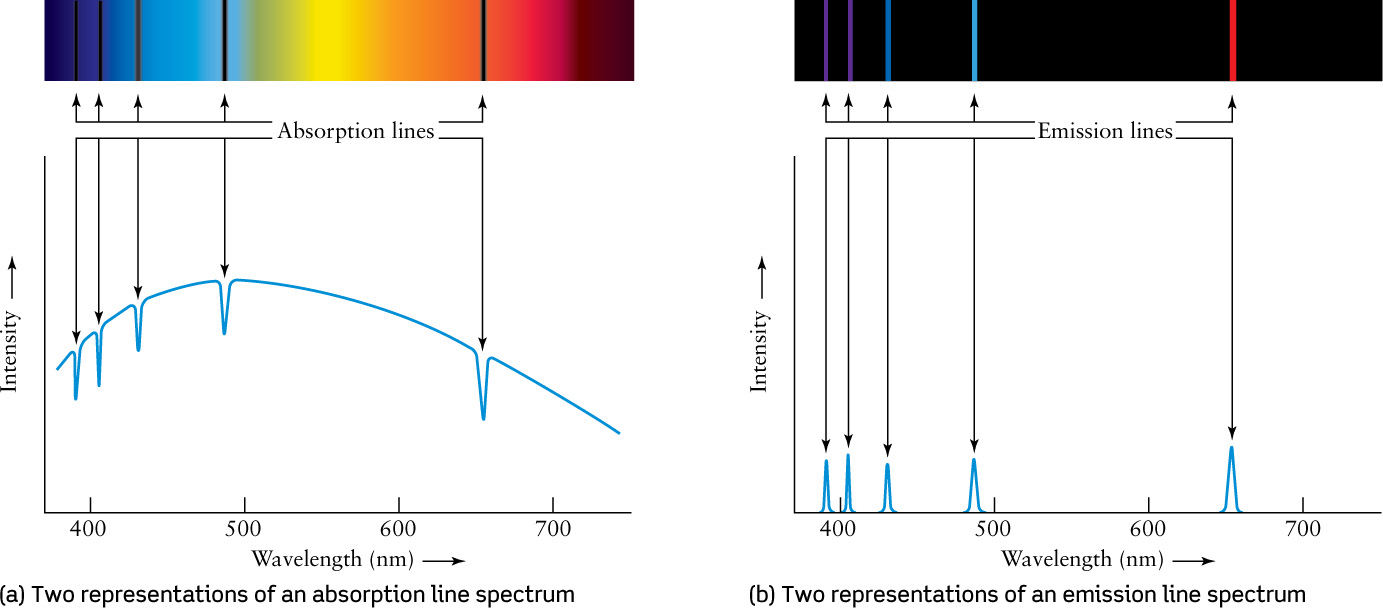
When the exposure is finished, electronic equipment measures the charge that has accumulated in each pixel. These data are used to graph light intensity versus wavelength. Dark absorption lines in the spectrum appear as depressions or valleys on the graph, while bright emission lines appear as peaks. Figure 6-21 compares two ways of exhibiting spectra with absorption lines and emission lines. Later in this book we shall see spectra presented in both these ways.
CONCEPT CHECK 6-8
A planet is viewed through a spectrograph like the one illustrated in Figure 6-20a. Does the CCD also record an image of the planet?