Working with visuals and media
Page contents:
Appropriate choices for visuals and media
Integration of visuals and media
Sample: A student writer’s charts
Choose visuals and media wisely, whether you use video, audio, photographs, illustrations, charts and graphs, or other kinds of images. Integrate all visuals and media smoothly into your text.
Appropriate choices for visuals and media
Choose visuals and media that will enhance your research project and pique the interest of your readers.
Does each visual or media file make a strong contribution to the message? Tangential or purely decorative visuals and media may weaken the power of your writing.
Is each visual or media file appropriate and fair to your subject? An obviously biased perspective may seem unfair or manipulative to your audience.
Is each visual or media file appropriate for and fair to your audience? Visuals and media should appeal to various members of your likely audience.
Whenever you post documents containing visuals or media to a public website, make sure you check for copyright information. Although it is considered “fair use” to use such materials in an essay or other project for a college class, once that project is published online, you might need to ask the copyright holder for permission to use the visual or media file. U.S. copyright law considers the reproduction of works for purposes of teaching and scholarship to be “fair use” not bound by copyright, but the law is open to multiple interpretations. If you have questions about whether your work might infringe on copyright, ask your instructor for help.
Back to top
Integration of visuals and media
Visuals and media need to be introduced and commented on in some way.
Refer to the visual, audio, or video in the text before it appears (As Fig. 3 demonstrates . . . ).
Explain or comment on the relevance of the visual or media file. This can appear after the visual or media file.
Check the documentation system you are using to make sure you label visuals and media appropriately; MLA, for instance, asks that you number and title tables and figures (Table 1: Average Amount of Rainfall by Region).
If you are posting your document or essay on a website, make sure you have permission to use any visuals or media files that are covered by copyright.
Find more help with using visuals and media in your work.
Back to top
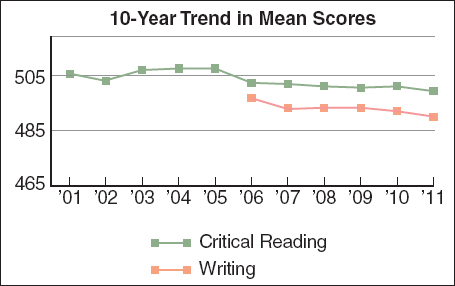
Sample: A student writer’s charts
First-
Back to top