Selecting visuals.
Selecting visuals. Consider carefully what you want visuals to do for your writing before making your selections. What will your audience want or need you to show? Try to choose visuals that will enhance your credibility, allow you to make your point more emphatically, and clarify your overall text. (See the following series of figures for advice on which visuals are best for particular situations.)
Effective visuals can come from many sources—your own drawings or photographs, charts or graphs you create on a computer, or materials created by others. If you are using a visual from another source, be sure to give appropriate credit and to get permission before using any visual that will be posted online or otherwise available to the public.
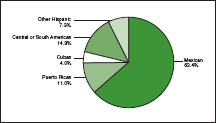
Use pie charts to compare parts to the whole.
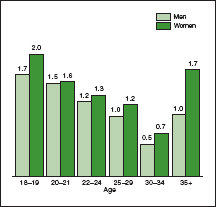
Use bar graphs and line graphs to compare one element with another, to compare elements over time, or to show correlations and frequency.
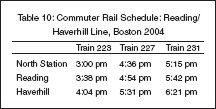
Use tables to draw attention to detailed numerical information.
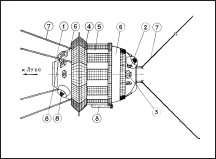
Use diagrams to illustrate textual information or to point out details of objects or places described.Sovfoto/UIG via Getty Images
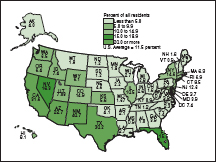
Use maps to show geographical locations and to emphasize spatial relationships.

Use cartoons to illustrate a point dramatically or comically.
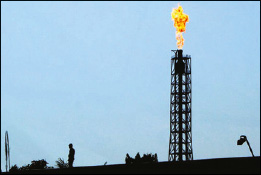
Use photographs or illustrations to show particular people, places, objects, and situations described in the text or to help readers find or understand types of content.