Chapter 1. Chapter 28 (Chapter 8 Macro)
Step 1
Work It Out
true
true
You must read each slide, and complete any questions on the slide, in sequence.
Question
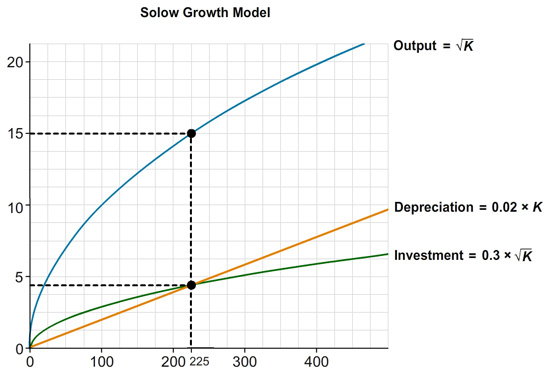
The image above depicts the Solow Growth Model. We can use this model to determine how the steady-state level of capital stock and output respond to different changes.
at6LwoXeMe9bRy0OQioyEltRpdmBCjPmx4jhV4C4Hsk7YgeGi03PbjgWlpFWLZWwXLeMWYZeYtMPT//pagsujcfRv53MeeiMjon5bRCepjj0VU6ZUCLMmPoM96Kn4ZHxR3n4A+uEpgpnTdVzRLjK+F4K81+q/7+sfzXWnV7F2QjCxkRsfRQCst9IAZjVMzzEeRekvVcQBExWPxNY1C/rY5/NCDBPdZzvbdg4HlNup4HUqYCvrCXSEQc4EemcsI9MxpiSWVHP3Bl0b9miQqObgqEfuVtwhqTyHgiysab6gX+O/bqYGyHCgu1TxdoIuPmKKPc6Hcy0vhDL3ldOgqy+XPv4HPc/4FoopuS2lgQZH+98K4+zvv4Y96WNzMQhVCYgS+EbUuDAHbiWc317lkr/9YAZbvcsgjGA8WAnhbguyxAuMJL4tJGprsNk0w/ySYwzPRnCQXrL9VcR3XqEfr/skJLXNcZ9AiSaIkT8iNoT618Gv0swCIltS4oNWvFHjGi3gVPjR5wwJGUSRwHsuW48VpOXzZ2J2zR12bwEV4H9d+P1ymtlBd9gTUEFrjVZ8gl2JifW2vEyns6g4pSpfI29svSNlUPFnDbZ76Zj5DaJvJMswKgMqeFrfTkz6zr+JMdIS5MLB60x3huRxspT/dTZc+nd8OYAQGlCRkvBHdVE6LM+iYI66/OyFDxOqUkswon9HGarG97ICWucNqsdmSkdhlVfkBb9xcjriQGDo+5KHsDACQU1kFJCn9Hgqz9orZedz6vfqBwRVplMJQPF4rwIp3q2nzl8QE0fhVxCB/0z0QB8V5gLk/BPGZT5ESdH+YDC7pja0V4J247Xg7eh086jE+AV4fPGDY2ndYJ83Ba1tLU7zT0pbIfVSAFBATAU6WHF5yoml6J629JfM6qDQVTG3F1hPRKbxvnQvMDmIlFvpGPwsW3lKYdWiViro59rmVGRRX/kljmzWG8pVvTkW25LNEuvsyu7oZVKvIv/uKlmdodSQmIpJ9iySF9os+xz8NyTkBECEHS5JVQ=0:24

Step 2
Question
The image above depicts the Solow Growth Model. We can use this model to determine how the steady-state level of capital stock and output respond to different changes.
HtxcIbuEBkts1ZpqY4i4qKsgsCeAK1eEZOYiHM/WLk42hVhHxLDpVJxYb7nCnX9/dxOikfOC/OtGTVCOWb+1vdBo7biniGWVc6TMGME24wJD10OrhBUxwzeRue2JGhNuOpOnMJw1csEz5ISGa4vDZotn57VQlRj8EsP4L6JGuETHVE5F6H/VXah//RIfyb8EHZQdpaHSgS/V+oDhC93nX9EmSGgTWql3zoxE+ZkjX7tQzAWhD2KsZpHlKzxCzG55/8FR40V84yAoZTu0G0WlLJ9hbxBSU7KfTbbihUJChr4q54q2zOz6MFYK4k45CIG+c3ujMBzbyFkHNZUdQa1pHsN8ZAvDB6bxD4YFfa2C13+Ae/Dx2+iYwj4YS6O1UhuEB3biH/VAR6WulX7G8zv+DHB1RbWNU45zxPyGnoPwlSz+VI9dhfgiLPKYf53lWrL39XDYupbGA/MeGH0lQubiNpjRTypJMGPoTY4VssNAiqWfWAyza2KAjnIgIDCWroFxTHmeQPa99ceCxPHx9wfepOt25ZFk8jysW7ynpFgoGZgpHsGOIlDLhmZnEj67EU1CHr7DkrYlQVeotY3BEn2CQGKNZ1z9zoPP5DxGrfcbzGSau+xQxW0+6WaGqF8MBK7OpCWhqWvhUX9qalMYPzvp8EjLb7W4OhKD8PyYIGdpe6KCXc8HLkaa4P/Iz0pb5x6EbI9Dv1EUSwIateooVnQ+ghz3Wrk6QOBzHnB5FnMZyTS582D5sp1A51u4GQeqwBu9T8PLMBObaYYqgm3VxpuKuvrU+xUcPFU+lZIMVKht+WEQZfhBfkeRNx8pM+eJlVbQOQnpni+b38cH5I0CmzTi+JUbz2r9kWon05IUfFkHxuszvfrjlgaanRXwkNwWUcVOsJ1GtLSeuhtmpgkziuqVDU5v2MkrNayK9FmHOGWebTHM2oIBvmn7Ws1ogCnuKN0lY5K0UXME1a9iX4t7I8k6YWd83n79ZJF9CY8+rtZUNGf0VeSVRJq5IH09ohrnN2gTRm4gBOBXihDR9wj82DME72UxCu+0jc7ssBa6TL/wb1ZfoDzAAs2fzF+0wneGr8RsPyu9y5WO+uUH8+Tnt5ndRpQvrSAjsXewYuzbhcdQx2eUerJ9NyaP47qGAP1FQK8IsuaZ0xQY0v4YtprvhB5cw4qyZEyDl5Q6TecAT2BksmX9oxqmK+FNPkU6ErlgRY4QtWFRTtkqiEKFdlkEsQ7GXuegrre5unHaqQp3UZwSOIperwGRN8eY8JwoFTdq+12lZml1g5ZJxAKdkxrC/+qAzL0uaFb07woRGySClPhMd1UrpadGxb+oCdG1RQQIATxKrlhFpibFd0S/sKxrIkMuXbMK9QOsRxXBpCJlDg6vrrXvR5xlGVSZmpYxN2SO7SraYGeavE6eVWQpj1HDwUeFad6tM3ZABVwGCdZQmavGG57vG6bj6wp5fqPrb2qEJD9tL7I0lwEK1/UXisTWoIN3fIdfUxBDOErGVUgU86RUjJLTfI0NYyJ5QsVsvnYDkDgFjVoNWDwBtetoji3+S6pIs4SfxPR+Fpf10:59
Step 3
Question
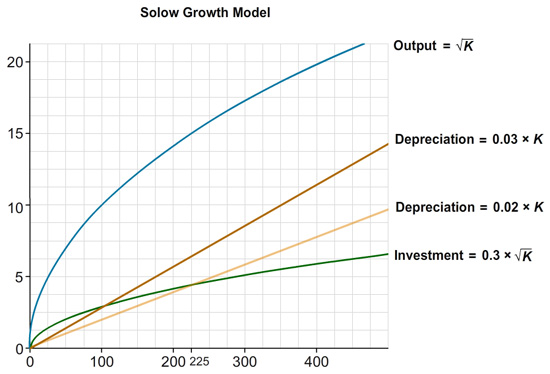
The image above depicts the Solow Growth Model. We can use this model to determine how the steady-state level of capital stock and output respond to different changes.
What is the new steady-state level of capital stock and the new steady-state level of output if we increase the depreciation rate from 0.02 to 0.03?
K* = b0g0iQ1whKk=
Y* = Pz2PEfhsNWI=
0:44
Correct! The steady-state level of capital stock will be 100 (where the new depreciation curve intersects the investment curve). At a level of capital stock equal to 100 output will be 10.
At the steady-state level of capital stock, investment must be equal to depreciation (the curves must intersect). What is the capital stock at this intersection? What is the level of output at this level of capital?
Step 4
Question
H+Vfx4QGseN2IevWdAGHhnTi7EiQA0eUatXQv7F5PV8KBGWsI3bYX6Seqm4jsNlHH/+BgJIbF9M1PdhtSCBRoiFih3mghdbLbiCGfXO1Cy6ACRSDS/Cy8JwRLWm9wIhr8QdoskBv+lSQPc3vJRMaWPxfkfTzTaHuXL71ou/u0KXtsFYCJlij+YYnIDER3AH4Z6KodVllCv+dSTC6mXH3vNHtLLeMK6xoZ37dGLWAZZvEvQ3CjlSueZztnTQ/lQ4U6TQMlvYtoZ1aClI5YZ47pszr/T2aTKLLuSXz2yRsrlBZVCPaVpbjHdgt6vp6dW9kJHwL1kXYoKpSKSwFae7zB2G7bbD+KcsdbkbYw/gfaCwMr0QJV7xjWtOv9Cuqv8XRjQh3pZzVUxMzEoBvP6l/79Zk+61GcInPZ9Pirw==This argument is not consistent with the predictions of the Solow model. You can see the labor that goes into replacing worn-out tools and machines, but you can’t always see what that labor could have produced if the tools and machines hadn’t worn out. Borrowing from the nineteenth century French economist Frederic Bastiat, we call this the “broken window fallacy.”
While it may appear that more output is produced to repair or replace the worn out machines, might resources used in that case have gone to some other, more productive use? When resources are used to replace existing capital, those resources must be diverted from somewhere. How might that diversion impact output?
Question
a9QVFukEOsNYgAY+qVrIsRKSmVTIF4WUGCnpJGYMJFd2ToF31:12