Chapter 6. Chapter 6

Step 1

Work It Out
Chapter 6
true
true
You must read each slide, and complete any questions on the slide, in sequence.

Question

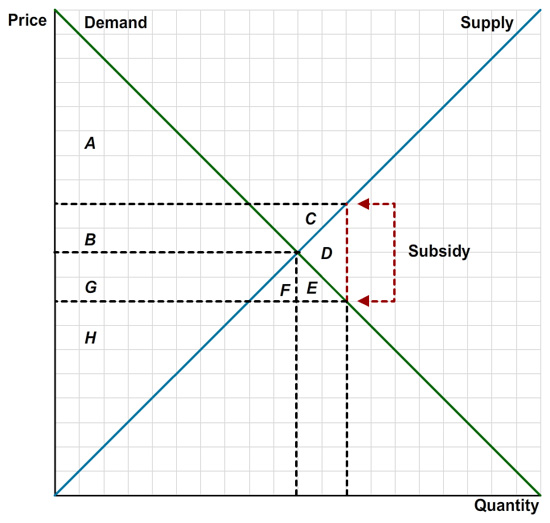
Consider the following supply and demand diagram. In this market, the government subsidizes the production of this good, and the subsidy wedge is indicated.

The plot shows the quantity versus the price. The diagram has two curves: a linearly decreasing demand curve and a linearly increasing supply curve. These two lines intersect each other. There are also three dashed horizontal lines and two dashed vertical lines. The first horizontal dashed line intersects the demand and supply curves below the point of curves’ intersection. The second horizontal dashed line connects the point of curves’ intersection with the vertical axis and the first vertical dashed line connects the point of curves’ intersection with the horizontal axis. The third horizontal dashed line intersects the demand and supply curves above the point of curves’ intersection. The second vertical dashed line connects the point of intersection of the third horizontal line and the supply curve with the horizontal axis. The second vertical line passes through the point of intersection of the first horizontal line and the demand curve. The segment on the second vertical line between the supply and demand curves is labeled as Subsidy. The area formed by the vertical axis, the demand curve, and the third horizontal line is labeled as A. The area formed by the vertical axis, the third horizontal line, the demand curve, and the second horizontal line is labeled as B. The area formed by the demand curve, the supply curve, and the third horizontal line is labeled as C. The area formed by the demand curve, the supply curve, and the second vertical line is labeled as D. The area formed by the demand curve, the first vertical line, and the first horizontal line is labeled as E. The area formed by the supply curve, the first horizontal line, and the first vertical line is labeled as F. The area formed by the supply curve, the second horizontal line, the vertical axis, and the first horizontal line is labeled as G. The area formed by the vertical axis, the supply curve, and the first horizontal line is labeled as H.
tWe6mgiepr8AQFRIZNWWtYTnE3o+Zeym9o+pBam6OYSQ/4Uq7q29hpZnCcgB5pCld8OA3qDTYWLL422U/ccNDEEP7STAovaArGAs6UONcegIarsHoA+U9gMsfm4STuD6ll+L3+4I4l6I8aX4EhR+ROPxJEMnbsBwl9TcD25YVRFTApCG8JUK2jYea+c+tHdpn80qQJ76kz4FqhMDnnS1uXuu+t3Ohm8v0jns8OdvPWpmEk7rT7WnI9ZW++UvF2EIu3/skegW4uov3UART7wLPik+E2xn8fTDBDNbTffuFVcR0ZV7/0yEh97pI1qmXGfEimmzQ2eIMoWRBhvbUA6aVFJmuXZEooNws30iQ75m4z+6oNg+tHY8amXJNrIYRqgILOnldY8SaTznKB7CQ0zMZdMGhx0SsA/fWo1hLvQSGjzDSrYyjJE97hPJYLJHobsZdAJpwPXmTVtTvJOS91gw/lZ5Cn6vmv96w62Nyk3ipCLq/Sqjfbu4eKS7Eiu2nCXS3Zx8irNEasPFTJq+T8ejs+eMUHXYAK3FcaedRvZ0lj4F1UkPelZu5yiy7Z0zMd11sQNtP0LFu3S9e9P5v4z6KBxB6R/IeltxCP8PK01YkEE50Pxb5W6omGCdxXIxElGz8j1UZkY1lgVilNx4nm4Gqj+GRIP5aTnKst+W2CPWJAIDsAkbV5ABpQpzqb8enuV7hhd5OlJF/hPWTyh8TZaJe0kJxgJp+whnsf0EC8r93rqx0s0CIuo/YtGR2Qi9SvlhfNNYHQ7sQZnsQsHfro3T87mU+2LWsiTgXYS4J9JAYfd2rtxHu0x1HgGvPhs66LnHGRn+a5CiMz7q4+cPj5XjBYq+SBdN4M8TddwzqJRlsOCIVIBwkmQsOUI9+N3ZJD8I8Kd5SWcv2102mhF6d2MBv0xCdf9L95/kjdhNGXH49a0V/gICphS0OYFhKZNXBq+qR5caclvF0ejMpRSycxbSMk9mzsaemOyL/tX1TaiY8jLWKFAkiOoKUG4iuR+VJ3TL1ydSlmo6LOmDIK7wrhvEq7Ii7jxIafAdPBTWmywMDr5/Nu3VpjSvZhGlt6uhT2TijSxHx8JGvkgEmxd4P+syO8MfPJ4syfpdisLvLNf0rKJfNgh/MVP5m+cvJMmoMzTzwY18ytS96OqpD7XPBQRE+qXzs20elMD5Ga69r8pKHP8s0U6I6U2kf00xCv/lLDEquLS0ZuBbumbYLdNDzVWqRPiWwux2kC/yJSJ+NXqzL/Pxm4VXe3sU6wjaLGdO4UAhwEGqwOFVs/zVYrNRXjJTyVOodECUyWxcN71OuWqNm9jq8WQmxjI/WnOOORjm199KcN4UUwjyz8q7rxp0S48PzFHjNZ/x5ZtEJeRBCocsGf+o7QS1YTNGe/PlfazrOPQzfAxaibdulRAPJu2FECZdvEL5yscqJ2aPA7JduFLpn/E/JY8DiwfdS/gjjTlTzWVmnppcGX1oZHZJu9nh3MJpyyNU8ndeRSqK
3:21

Step 2

Question

The plot shows the quantity versus the price. The diagram has two curves: a linearly decreasing demand curve and a linearly increasing supply curve. These two lines intersect each other. There are also three dashed horizontal lines and two dashed vertical lines. The first horizontal dashed line intersects the demand and supply curves below the point of curves’ intersection. The second horizontal dashed line connects the point of curves’ intersection with the vertical axis and the first vertical dashed line connects the point of curves’ intersection with the horizontal axis. The third horizontal dashed line intersects the demand and supply curves above the point of curves’ intersection. The second vertical dashed line connects the point of intersection of the third horizontal line and the supply curve with the horizontal axis. The second vertical line passes through the point of intersection of the first horizontal line and the demand curve. The segment on the second vertical line between the supply and demand curves is labeled as Subsidy. The area formed by the vertical axis, the demand curve, and the third horizontal line is labeled as A. The area formed by the vertical axis, the third horizontal line, the demand curve, and the second horizontal line is labeled as B. The area formed by the demand curve, the supply curve, and the third horizontal line is labeled as C. The area formed by the demand curve, the supply curve, and the second vertical line is labeled as D. The area formed by the demand curve, the first vertical line, and the first horizontal line is labeled as E. The area formed by the supply curve, the first horizontal line, and the first vertical line is labeled as F. The area formed by the supply curve, the second horizontal line, the vertical axis, and the first horizontal line is labeled as G. The area formed by the vertical axis, the supply curve, and the first horizontal line is labeled as H.
aU/vBXMIMLuCSayb1Kz0+cZM7IXivoK2VfsmrhQiXjMBt3kzboGUdtZNfIRIFVqrbC9xEw5JoomhNteRHddfN/bYaKea5WVit713Iao7Mdd2WjCGORH4m6X1Qh/wWGR/DL4zr7vryU0udoAUKkkDo5/Jal8gSKd1A9H6nxbrmJmB9gvjirHc+WyHTtrjgC8lBAe887u/FxQvVjevabY1iCXj7qIjn7jyi+7sP10oKeKsmDUqsFu1epjLjNVoRMVjiBx2f5hVg3K/fRae2PQhMbszkvUtIjWVoc56Z9r/FC4PYwkq2M4i7KpHApsiFAh9zl6QrcMxUOQvpVQXPBq+lGsMv26kmngMieGvxloH8GO++4/iPoXKuRU0BWvZN6dUvHXtyJ0gLtXbIr0djv2dZXnqBBYdwPtInENz2YOI/SyxCchL/KgJuDa3jmvwi3fggZrFOaxOKJZOm8p5v17QNkuSKB2LNWDQK1WFqldyafBeQQLvYO88PkmMTcX+pIyEfSz+eM1yb2d8gEKybE/Yvd9mVs20EMbaLZKNyHJbMW/j7ZnwkfiijmX0j3sWW+6AT+V1Pzk7iWhSNbxOXK80dpCyIYN6nxg3psQwyer6iYpo1HJgaisUfvXiy0c6ZsoI5v+q9bilMOFxCywejd4LvEnQ9aWg3JaevLCoOiWEmSw0DbxgkdFKHHLPmKbhtf6D2It7/+xoeeI9uFTH5Y3JyzeiIfYGvhkIWqbP0sUXyy0Gx/NQTaTtvYy03I+WJzW7FnPl9FQFmyHU20NW7FjvcAduYYMBAojIb5FIpOtJ0YklqXWi58PeMEED/4Nm9fGVDAtJEx7pAp7WGQ/Dr16BJ48uPJQkw4/+t9uHHCmoTVE1Nr6YNgmBlCiF/fDPc+tedtFkNSey4vsyAbf6vbT6Yka0KbGyloQdM7/kr5yQ6jCfJcOfCB7vNqsSA3H/VNRAjI3dJPSUV9zfoUFfeMGAASyxF5/XV+s8vjc4rszHhGBzsZduURpNJMSSNTZ4RQCyd5a0w1WJIduWiPuiLAqn/Cl3EgzTF4I4qA7QiNh6hGi61Fz6JwiIQmsAHAnCveNWYMjTMc1LPz4UWFo5sO8T396pOnoLvu1k5iTLv6IEfWUTt7iJkpLVMj+B6GDfsbkZmRvrXBcy2oCsTXNR439K8bNIb8X88axduUPiRvHv7m8JW9sgjlw5Lg+S5ZB+WHzXz/15qx3ikv82XvrEdJxajeSV/nhgeRgRRB/gtkVDpMzzV8IKdZHihltdzvepxuV99jaDpIroYIzGRxWESBggIaztjK8R/opCULmTViJVXpfiFUsKJFI6J8KeWh2z4pUHaAe8Aoz8rLHgz/GR/OBJ4RWcUe4azLo+4haDegHMN+yFf+AWnRXsXm26VgARCnzgM0YPLyAoFxaLzcdw0SIwak7/xQDCd+vDw7uoB/p4PHJ738lmlTIf4X+puwMe+9BWBvCWLc8UVZUt0tQDBLNsHZ+c5LOjCuK5TEgLJOXGi6pjQMhdRpoLP31jr7F/7VZzW5xm0vLxVxWDOsD16mqpAFQDPTR+UBLeloyCFnt8vOla4fUq

Step 3

Question

The plot shows the quantity versus the price. The diagram has two curves: a linearly decreasing demand curve and a linearly increasing supply curve. These two lines intersect each other. There are also three dashed horizontal lines and two dashed vertical lines. The first horizontal dashed line intersects the demand and supply curves below the point of curves’ intersection. The second horizontal dashed line connects the point of curves’ intersection with the vertical axis and the first vertical dashed line connects the point of curves’ intersection with the horizontal axis. The third horizontal dashed line intersects the demand and supply curves above the point of curves’ intersection. The second vertical dashed line connects the point of intersection of the third horizontal line and the supply curve with the horizontal axis. The second vertical line passes through the point of intersection of the first horizontal line and the demand curve. The segment on the second vertical line between the supply and demand curves is labeled as Subsidy. The area formed by the vertical axis, the demand curve, and the third horizontal line is labeled as A. The area formed by the vertical axis, the third horizontal line, the demand curve, and the second horizontal line is labeled as B. The area formed by the demand curve, the supply curve, and the third horizontal line is labeled as C. The area formed by the demand curve, the supply curve, and the second vertical line is labeled as D. The area formed by the demand curve, the first vertical line, and the first horizontal line is labeled as E. The area formed by the supply curve, the first horizontal line, and the first vertical line is labeled as F. The area formed by the supply curve, the second horizontal line, the vertical axis, and the first horizontal line is labeled as G. The area formed by the vertical axis, the supply curve, and the first horizontal line is labeled as H.
w4dohgfbhcv9sJAlPpot4znz9nOXrotUVDmL0F7et9w/kzhBIBnuXt4R0tCwJwft4Uadygf+IEAHUc5lVVo6h5uNC7RkToWu01tIfHWVoko9fY5njD/4539wRATPGr8KHI7TUmZ0uQ7n1OU1fmmkrV8mHTgdWk7LXHrHo/s/vFcYSyPru7RM7KYlS+TQdpOKxal6NKWOFlEAyyjltV/QFvHtS7FV8te5iCzbAVYZ+EP2tOVk9/HEd2Agd1qXblT/GLaTf+WJaOHrMVUJAhyI149GwHFDqt+PJrloppnv0n+8P9z+BV2vx096KZA3zzBgxvJJu3z45FFOJE5g0amQGbhN9S+tJujQ6eMkmeAQOW4SJROD/ko1pkbANsIJZo2lIIoRbDLFpcBQ7vSCoTLsr0HbD+Bl8NmDuQZ2dKkigWW+zM8TsJPZyri65l44/1Mj16ICkvrotQzt7B87v07XnpSgc7fcavlszp6emRVCs/j1jEDYJrsyf77y/1KE95lshovKWdMvG5Cc2E9/l+d7o5wVNAukKw3RioFpr5SCiZjzisywVODNnPnejfg5kPYoIkYjYRoWCo/Soo7RH2Q8ly8wkPASE7ICZwkVSRiBWxwXrR2YZYTypVRgge2phoH7Tpr5HxEiDUn1bMycnGyTTNKV072DCK9caIdb2enQ6dqGxygfGL/vjrEqfJlCr6prpA05qfMwuM7FlughdvgqzZu77ezn2fKP5d98p91fz+gzgejnl53bYjGEzw3qBHKLZ2KFDC9fFasYVA3YNCYUfkq+SDmulhAJV+3xCS+EzUoEU1DY8lmJoCFkZ07r22BuHSnqS1/Kjf1hLIhwvWSqA0TsmPOneE5FzdkMbKQI+bY40Y0R49bbqlxd3bRtWzyGiGkJ5QhxHvai5/2OOuOaJA1+gTq37PBgF8hcOWU2fE7a7972/lEZTUCdZeyDIuhP3DWd+wmQS1lyRuj6cgXTsUhUjDdTc1Wx48U4vYsmUrqcYGPNBiCoMu4EyucDJO3SmybPnWZburOQq0W5T654OetAZ8gc0Q1Ka3VmUKYZ4HcoEgQG/nCMVl35aRumDNauKH18FunsM2c37Ppc/nf4doEsngCCvH89LCUuOAiTGu4eWDXYSJhkn1qO5eat4aik1IRCnPibZw/VpGiBM0nyCL6gv1Rn2kjKYc436h8zIMj7USUgBoBA7u6rtSn4D1peAfC1RvM684iYEGNEuIWCu8gn4tBBa2FWW2fsQAZt7Wn6zkfAMucjCxm0pnLKrEfrkBuq7jKnCPSPC/FWimF7lxtpnP+ra724F1kDvAvh0VBhaZLi2eO3d8JqIerWmQkFTPMcwwDViVipQ68VXFJbQOBHW0cNe2RRQb7P3aV+GQh+Qx7AAFb5W2IEaz4QpxZhaDgNYQTlCTrXEzl81hUQWw1+cjEktha3tAP6fY3mybGPfP2XTP65XY+j9JuWwUaFQr4ZkQFlaD3ernh0j1LtTA3BDmDnaLzIXOmD1azGRxn+btOV6qG1YkdfT751vZTx5x6e1dCzuobHQUBkp/d/ErDwsQ4=

Step 4

Question

The plot shows the quantity versus the price. The diagram has two curves: a linearly decreasing demand curve and a linearly increasing supply curve. These two lines intersect each other. There are also three dashed horizontal lines and two dashed vertical lines. The first horizontal dashed line intersects the demand and supply curves below the point of curves’ intersection. The second horizontal dashed line connects the point of curves’ intersection with the vertical axis and the first vertical dashed line connects the point of curves’ intersection with the horizontal axis. The third horizontal dashed line intersects the demand and supply curves above the point of curves’ intersection. The second vertical dashed line connects the point of intersection of the third horizontal line and the supply curve with the horizontal axis. The second vertical line passes through the point of intersection of the first horizontal line and the demand curve. The segment on the second vertical line between the supply and demand curves is labeled as Subsidy. The area formed by the vertical axis, the demand curve, and the third horizontal line is labeled as A. The area formed by the vertical axis, the third horizontal line, the demand curve, and the second horizontal line is labeled as B. The area formed by the demand curve, the supply curve, and the third horizontal line is labeled as C. The area formed by the demand curve, the supply curve, and the second vertical line is labeled as D. The area formed by the demand curve, the first vertical line, and the first horizontal line is labeled as E. The area formed by the supply curve, the first horizontal line, and the first vertical line is labeled as F. The area formed by the supply curve, the second horizontal line, the vertical axis, and the first horizontal line is labeled as G. The area formed by the vertical axis, the supply curve, and the first horizontal line is labeled as H.
RhhaJKlWxo/A6L0FsqP5DeR2kLeWgJOVObDpzCiVMbfmoQEce0vDyceTHNVBhcmQ+/uYgj9mBLF5TzG54ONGiETzel6OyOUJkgirGFw1hVdPsVXu55HsDOOiP/3yOSy5edsuoArjFirvS3uvo02nJX8KdxZlJx0kQmxUG58AhcxzaBqwGStO3cMVl69PG7DTxEpFaW9re8F/Sj4SPWWIiSMRyETHTaGa2VNAsiOgntJOaT+t9xYhoQaUlykRD35dJyxtuJCjLOE+5/uB/O0rHEF3YPCfHKeXrJw/QDfOlHnNJm+YpsBovNjXfNvfLV1FOO7UKuB2cTwqkLatVRFjNa36KhgLwzIalSrSDBc1FGbCGQlxv7B/sF0YaUpMf07Urokb04WGcXA5thE/DVwh8Q96BP95LqR71023qCpPpGl3aMuo+kbtt5v+wfQix/ptKFcHpAILd6N0OzWkSIjyISF4RUcz/Jk6PlSubtfEpL2vw1gvqu4MYFHdzUVeuqTNiXg95qsvDNW/cxuXKhHw52dx1CQkhiGC2jOa0HAmZtlRxKu58IMja++uZEOtIivpR3WwQw2LFxJHkQc4214wscPBQd5dsb+rtvq9MwHeLKb9m4axPl07m5xmTAImIUBrgBrRwQODBS+Sf+SzXDz8gNWlgtv8dpev2BvY07zCu6JCL0mn+6Y10xWv9T5LhXG2/pkaoCHX1D9gAJrLCpsfWUDrpvftpBw8QvT8P5NMUNeGqu1uqkou+3DlOpra6pgWz+hdsmmv7drT+Kaw6kFbTJ9WFYYr5q4GOSw/4W2Zi+borIdu/NpnINFgcj6RfWJJUENXzuwGEBTbJPu81GZe86NZf2NQ8hOH/a+sM/o6OgIkB5Gzmsq30MP2GmzFQY6fvkbenoZATblzZcCHYJtijbjdvT6PSor4Y8hAnfPiKCW+qRptg6xBVJFk/X8EpC7f+N/NrOiKKMEMXhs5hU6k6knuaGMlFwoknEQpfxne11t9t+BzEoR0nMKoEx6Dqp76z7rK2qUEZu8jhVR6hNuLHpTqSvS0QtuYLtjFt0blBvbRgRBnmSEyEU6EHSQvUvD1zllSdgGEroJcuGLRqGLo4TTp0hH3RyT/IXVYtWbI5pMgPGqGq941eLK2XGLunf1odkWW4Ay/6verW0vwbg+PKyuoSRGKVHMIF53IxXYuUu8Au9W3DBH9wY3F/qCjJ3Vf3ZklWdguy7UqySFykA4NIAlgt0FmkkyASifpInuk204Qc9an/IX66Xx69V8ovU6Ve5N0KnPw/hrhrYQUQtRa2LSlRIHw/ZiJQIdww3yqADGP0YulNwYSW1WWOV9xqXM5PHFhr/mUfdL24O9wBNzKGzWGyESd7yhYauYp6gAAQQXpzkRm7oRz2ZZlTv73/mvP0IwowP0+Got3E7xA+NTnwOLg0IyIJc5GNkWBxOhNX0Ua92QUMBmONnRMHNdlUW/MIN7t3sEBqd9EPbjAxpMa8X7MXirPB4EzFuImTbcyG/FJGYfoKTTZiUzIjTarFUhOOvfXOJiQ+iT35M1F6JSIGPRuKu6D5OFgGxD9gCcmohhEDTO/fMYGXk5mmG1MXyYKkuolyrAJINg9IrAnTDS1vocrgUCEKO82qlufhm7sBTurnWPq71UUXwwrw9ucJdOC21ctn+8INxjr437bxs5zz6ZEowaiyOjIpHAOqJvrwsS1RW1TmaR12d1Z95q7rquFrOKBulVfLemMUPdjdn6cUiOC+c8lriCgtYhpluO3dEfBy0dP4lPe7N4oX+o0VrYYLG4wadwczt5Dy0VtrIIlH5fwcw/VRcQWb/ovW4P0wPiKTdlUymBsVsXQAz++R99iPjuruJhiVnZcM1iJxwalORBxSEJ0BJnvWRv/b1kMRkL/mTXxyVnevbGXfYNNbewu8EvMNwI4CzIXMh29hpykngFNpkH3K1hurzb5/XBPGTwcD45MYcWYwyehTIpHG40voJ1I+SaDQ0enEZg6Huv6+ZwOkHEsm154jM3qJikMNHtbrE2IEP71DwXcc2RbsfhuDyQ1gNoA4jdiptS0rWETOpw1mxNY7j6tscWH15eYLyeKsphUxOZeqZ87FF7ja0+oivffMZzWlwIMATUl
1:39

Step 5

Question

The area(s) in Questions 2 through 4 that were answers to more than one of the questions were qVIBv7aCf3i5rq9ptXxqRQ==. (If the answer is areas A and B, enter A+B; if areas A, B and C, enter A+B+C, and so on, in alphabetical order.)

Correct! Areas E+F+G show up in Question 2 as additional consumer surplus from the subsidy, and Areas B+C show up as additional producer surplus from the subsidy. These areas are also part of the total government spending on the subsidy from part d. To review how to determine the gains from trade, please see the section “A Commodity Tax Raises Revenue and Creates a Deadweight Loss (Reduces the Gains from Trade).”
Sorry! Which of the areas in Questions 2 and 3 show up in Question 4? To review how to determine the gains from trade, please see the section “A Commodity Tax Raises Revenue and Creates a Deadweight Loss (Reduces the Gains from Trade).”

Step 6

Question

AVyU3cfepbGhNEAU5PmlwRFwZwGwWZSUTgPtPCXq15z0MBhd75rSL0+GgGAzy2PXWprD2RzmBZ2nPCSIconZGyvWvIno0qPaiWYjgeJV/S2tKR2y4vLn9F5+AhRGqhzMqEFReMb157tZ8y7xRz/5f/yYrWO9NAbMj+a+MMIcL2ushboaglnbo3lY3WJ/7vhhGkyxRdTHHg86BEE5gGTbcCiAOvbEuMVvWlunEuPft+ZLwhHS/9vxb9jLCkxxSip0C9pHGjr/C/GuwY44Qaoa6U1FyCYoJqkRWWqzidtcTdR8o1vqBGUIGrt1fGFwbyuMAFrhGz0ZU9a8rbIBWRTML2kCaJeWloumRbc1Zpat425v+AxykAxOo+leOMCCX8BA6/oI7/SA+zU1E5P7xDj+gKAF05D5gRcfsP+LdGcLBL2cXwoO31G4dShqqnzVOzPKwihZaHBN1R+qTziBQb9ZRwy/hCB/yLpBug+ja4uEKzSUtOff+3iUEmoCw7Rzg4/Wn27iNhdjL4etHVOP2ZPzZvqvJicyDv1e5G8CbfvDMxjCM6u/LyZmnerv0TuW4ET9xVf9cSqYtiy+41JtwJa/MmAEqQ5pXw7vDbUz5enXcDB14txbOVLs+EKcSjewVpLHUH+t/XTJHVN1nMXp5nRqd8Z7Ht381GgdVtaVlnFR8tMHnH2o2mSWvlgR4DAog1CqIFpB6rQWbE+ZMFTami0Lr58y6taBnQTOORk4T8VgBrDIb8K4o55xorwIcaUCjlAFawrCe5WY+P5WY7NmzQB0GryNML31qijFrTnL9erw76CWrUBj/Hb3Qrn1RhnDpR8StWltKkR2ER8R62uibI2MwtI1gEN4ukkkGZJ0bK2MGi6I6whh1PJap8C/P/fjb/s7lkfiJ6YX2N29OSRLhY6MH8z4wudpfEKB6yT5fpEG3VgeIX5+KGCZJ2MqDxFhO7gtBtJg1RguFDRXiKTQDbPefAUKby1vREUcs9uGmeP3GYpCF/VR6RdxshkeVYL01DcjiwUumr1NPdnfK/5nJ6hNwwABIOmxQTM5eNwt2TkeJhxJHhj4taV+ckYQitpJIMQmblYAeWL1iPnNrWYw41MG7O3Qf3bXi1WaZW17o2w/DekPSlL5V6DtQTX5nmU1cLkyTvr7/z/dj2shTvz5LEfw+1bYzD8XAXza8NalsPnmxgHc3+J1ka7fznQHUtTgY5vKvRCvq0EMXq4Hfp/gLSVY+j74wJMQgxnw2GdVpRfWc2Lq3uEQJl1wmnzxZ8r+DDlF+CDjQLcPFrk7gpxhiIj5h7i+FzzP5saL21uJfZqA2bmZpYgu4AsVzrFY977dtiSFy9cdOPCG4bkxtjeMVefhQmXWfg6bx57wDsb1xo1ep3lMkHA97w9D8tn96mOPqHeBFdAlOgIsGwVLletx0pIfexq9PlixTX1OP8P3Po75sbgcttT8vmx9GIi9K4bHp8MBBiLyWy0kw04WNc0A/dnzKRzUTPVqgMMRH7EY09fZes5BvK5G9qu0sDvt0qDa4n1rr67iIdO0Xq10i8J7Sx/XVr+neSbu5fdk9JKnPv3fIf0ReABdNsp1AoKhGdIeUWVz4/tFCCOGXXkx4dApdwJJQdQCaAXu85wjOYl0V8cz0Hsj+3HHjYT13jnfGddHm/XifUaF1dx6fJM49HenZnWX3z+F245CgCkJRSRCMyRRAHR0vIlEZvU8yMjYjdd0r3kdF7prp7qnLhxKLVs1aKIuTr1ayfRuiYC6GUICv7129KGN4yfDQiFWtsIdoiqLUtpqQNWqMVFwWRGPoMdup9KbtW4/s0tOosBNNZ/DC3nL/gS1Ll7aQpiSXM6YpM2rJhOBb/rSutXALYUe+5hcYGZ/85YCYZxLdTTzuriRfy5zp1fDsscJ+M/tcb2imo2yu9yHJrs98nNMyp2otjqB2H/VsfuXtqerxtMr82rMW1xIMeFik9bkjURq9WzjfQwsIeQ1lBbQ8ByFzRfJ/0qQ5BCx/FurHT/9AFqpoV+qkaRqcmnJpNIgmIYWrVAEPe/HURDyE+oDUrIyHJISzZf9zCi5ufr4t0FqKlS8vg3IJdBTVfzupl5wkO9cU8e7fr8ms+gQ+jlvZ1XpEP8zpTs6Aa1sB88vImBOBV5smCtv1oKuOP7b3P1OQY+TuZ5nI0neBcMa7ObxOs26AI7vZc901w5w+G+b0FQMI8Dbi+dLzi1BOCc+2Qlql+ZSCmFrbMRsN5Up7ddJGEiaErZgMEZfFqvxhygyuLU6nwutfe+Q+fuf3khwHgakkf/xj2L/mKvVBb6ri7aDV5mdVdmNzUBbt/FBtaGrW8YRNFTwrws11uIn/G1/ZLSFRv6RR//jr4OajNrnxwaPKYOUdF1cBoyorNPdlZ7IysHqtpg32mCuItOr3w6kwDUgNIxOBuIu9VNwB4OhKQap7kPkeZAta2lGrSGP7BjjGQAmhmocsVkwsuJauG9C4AZQqM50rOL1GUI=
1:40