Chapter 2. Spectrometry
Spectrometry
A light spectrometer is an instrument designed to detect the amount and wavelengths of radiant energy (light) from a sample. This can be light produced by the sample or light transmitted via the sample from a light source. To do the latter, the instrument must have four basic components: a light source, an aperture or slit, a detector (a photocell), and a display the output the results.
The arrangement of these parts is shown in Figure A-1.
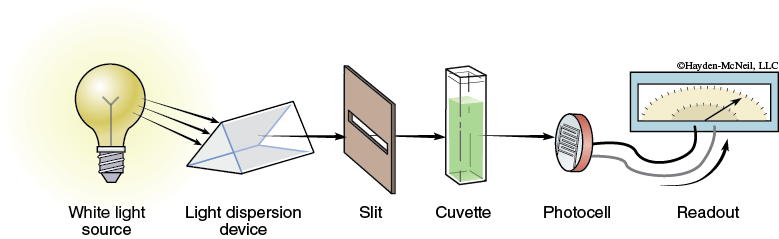
The slit allows a single source of light through to the sample chamber. Light that passes through the slit travels through the sample chamber to the detector, where it creates an electric current proportional to the number of photons of each wavelength striking the detector. This current is transmitted to the display.
The detector can be set so that it measure all wavelengths or one specific wavelength.
Operating Procedure
1. Turn on the spectrometer by holding the power button on the right side for about three seconds or until the LED lights start to flash (see Figure A-2).
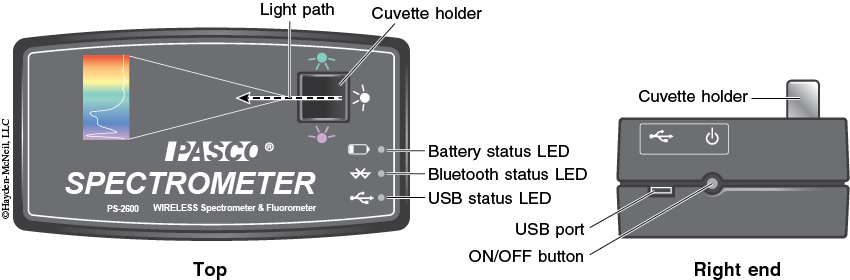
2. Plug the spectrometer into the computer via the USB cable (see Figure A-2). To wirelessly connect to the spectrometer with a personal laptop or tablet, add a device in the Bluetooth settings and select the spectrometer that matches with the ID # on the bottom of the instrument.
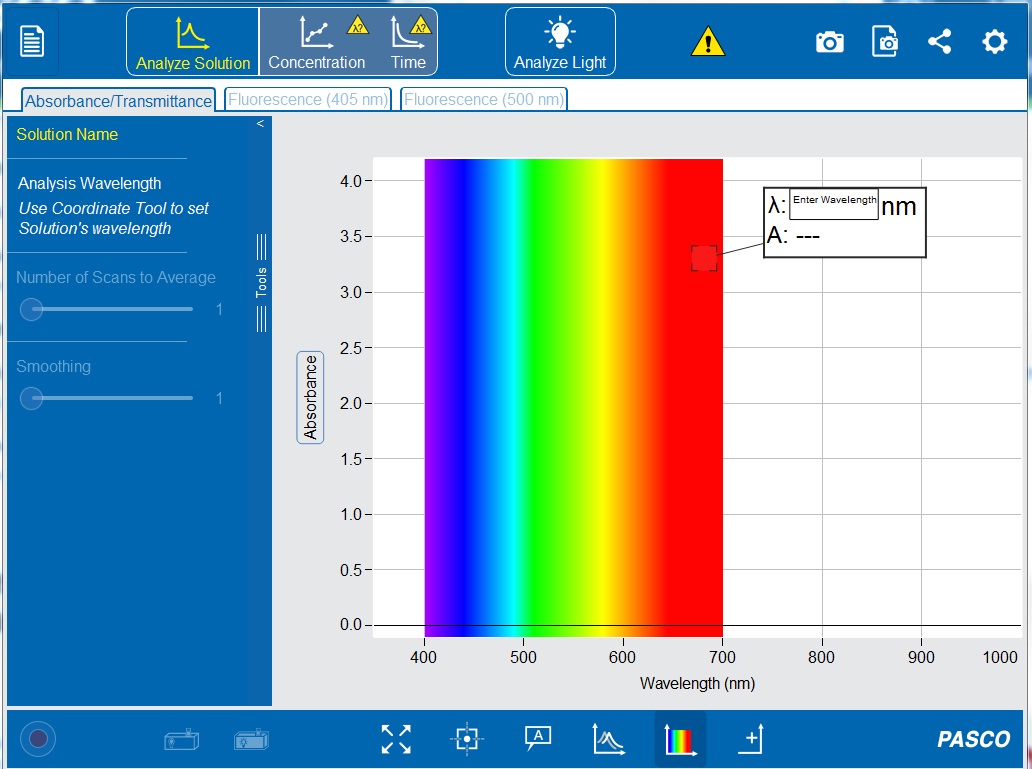
3. Open the PASCO Spectrometry app by clicking the icon ![]() .This should now show the initial screen of the PASCO Spectrometry display (see Figure A-3) on your computer or tablet.
.This should now show the initial screen of the PASCO Spectrometry display (see Figure A-3) on your computer or tablet.
4. After a few seconds, the ‘Connection Status’ symbols on the top toolbar should turn from ![]() to
to ![]() . Click the circle to check that the ID # on the bottom of the spectrometer matches the display on your computer or tablet. If connecting wirelessly, a ‘Sensor Not Found’ error should pop up. Click
. Click the circle to check that the ID # on the bottom of the spectrometer matches the display on your computer or tablet. If connecting wirelessly, a ‘Sensor Not Found’ error should pop up. Click ![]() . Select the spectrometer with the corresponding ID # and click
. Select the spectrometer with the corresponding ID # and click ![]() . If a connection error does not pop up, click
. If a connection error does not pop up, click ![]() on the top toolbar.
on the top toolbar.
5. Make sure the “Absorbance/Transmittance” tab ![]() is open on the top toolbar and the “Analyze Solution”
is open on the top toolbar and the “Analyze Solution” ![]() setting is selected.
setting is selected.
6. Wipe the blank cuvette with a Kimwipe and gently insert it into the cuvette holder. The cuvette should fit snugly.
7. On the bottom toolbar, click “Calibrate Dark” ![]() to calibrate the spectrometer with the light turned off. A progress bar should appear, and after the calibration is complete, a check mark
to calibrate the spectrometer with the light turned off. A progress bar should appear, and after the calibration is complete, a check mark ![]() should appear.
should appear.
8. Wait one to two minutes to allow the light source to warm up, then click “Calibrate Reference” ![]() to calibrate the spectrometer to the blank solution with the light on.
to calibrate the spectrometer to the blank solution with the light on.
9. On the bottom toolbar, click “Start Record” ![]() . The symbol will change to the “Stop Record”
. The symbol will change to the “Stop Record” ![]() icon and a horizontal line should appear at 0.0 ODU, indicating the spectrometer was properly calibrated. Tiny peaks in the line show noise, but if there are major peaks, repeat steps 7 and 8 to recalibrate the spectrometer.
icon and a horizontal line should appear at 0.0 ODU, indicating the spectrometer was properly calibrated. Tiny peaks in the line show noise, but if there are major peaks, repeat steps 7 and 8 to recalibrate the spectrometer.
10. If collecting data for a single wavelength then, in the “Enter Wavelength” box on the display (see Figure A-3) type the wavelength to set the wavelength. If the white Enter Wavelength box is not already displayed on the graph, click the “Add Coordinate Tool” ![]() on the bottom toolbar. The coordinate tool can also be manually moved to set a wavelength.
on the bottom toolbar. The coordinate tool can also be manually moved to set a wavelength.
11. Click ![]() to set the wavelength. A vertical line should appear on the graph at the wavelength selected, and the white box should now display the wavelength (λ) and the absorbance value (A).
to set the wavelength. A vertical line should appear on the graph at the wavelength selected, and the white box should now display the wavelength (λ) and the absorbance value (A).
12. Remove the blank cuvette from the spectrometer and return it to the rack.
13. Wipe the first sample cuvette with a Kimwipe and insert it into the cuvette holder. Instead of a straight line at 0.0 ODU, an absorbance spectrum should be visible on the graph.
14. You can increase the display size of the graph by clicking the “Scale to Fit” ![]() on the bottom toolbar or by clicking on the axes and dragging them to manually adjust the view.
on the bottom toolbar or by clicking on the axes and dragging them to manually adjust the view.
15. On the bottom toolbar click the “Stop Record” ![]() . The symbol
. The symbol ![]() will return to the “Start Record” again.
will return to the “Start Record” again.
16. To edit the name of the sample, click ![]() and then change the name.
and then change the name.
There are many other options in the PASCO Spectrometry app that will be utilized during the semester.
To compare the absorbance spectra of the two samples, click “Show Comparison Mode” ![]() on the bottom toolbar to overlay the two graphs.
on the bottom toolbar to overlay the two graphs.
To take a picture of the graph, click “Take Journal Snapshot” ![]() on the top toolbar. When the image appears, click the
on the top toolbar. When the image appears, click the ![]() download icon in the bottom left corner to save a .PNG file.
download icon in the bottom left corner to save a .PNG file.
To record the absorbance of a sample over time, click the “Time” icon ![]() on the top toolbar. Next, on the bottom toolbar,
on the top toolbar. Next, on the bottom toolbar, ![]() click “Show Linear Fit” to display the best fit line.
click “Show Linear Fit” to display the best fit line.
To save an experiment or to open a new experiment, click "Experiment Options” on the top toolbar. Note: Anything saved to the lab computer will be deleted so anything you want to keep must be saved or sent to another device.