Chapter 2. Molecular Biology II
General Purpose
This pre-lab will present some of the general concepts related to some of the techniques used in the fields of microbiology and molecular biology and how these techniques relate to understanding the relationship between DNA, genes, and traits expressed by an organism.
Learning Objectives
General Purpose
Develop a basic understanding of some of the techniques used in the field of molecular biology.
Conceptual
- Gain an understanding of the relationship between DNA nucleotide sequences and phenotype.
Procedural
- Gain proficiency interpreting fragment patterns in gels.
- Gain proficiency in analyzing plasmid maps.
Interpreting the Results
During the last laboratory you separated fragments of DNA from different plasmids. These plasmids were also used to transform bacteria. These plasmids had been cut with restriction enzymes. You will finish those laboratory exercises by analyzing the data to determine the identities of the plasmids and the phenotypic effect of each plasmid. There are four parts of this analysis: interpreting plasmid maps, interpreting the results of the gel electrophoresis, determining the phenotypes of the bacteria, and combining the plasmid data and the phenotype data.
Interpreting the Plasmid Maps
The three plasmids that were used to transform E. coli for this experiment (pBR322, pDR1453, and pGPS1.1) are shown in the following figures.
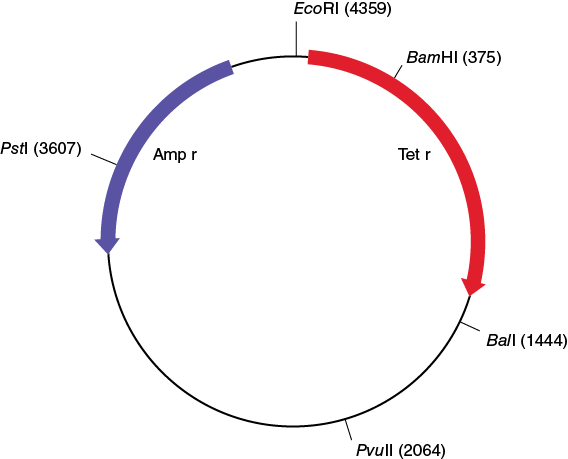
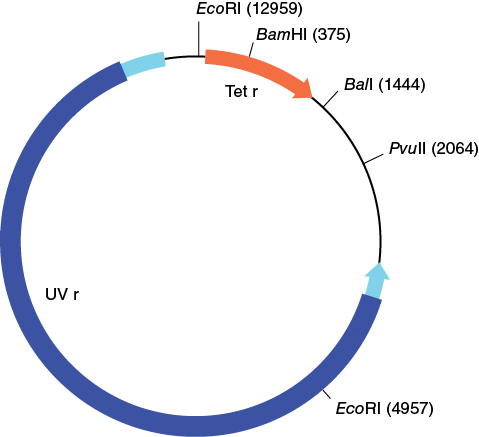
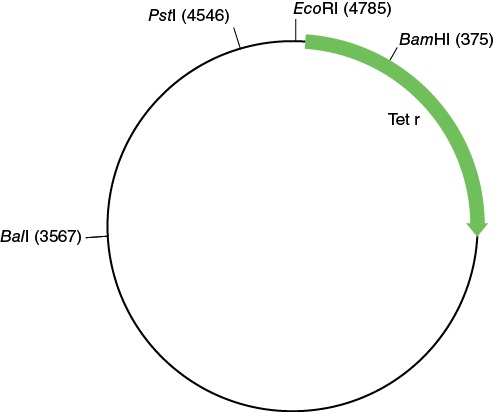
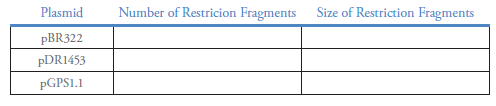
Make a copy of Table 12-1 in your laboratory notebook and use the information in the plasmid maps to complete the table.
Table 12-1. Number and size of the EcoRI restriction fragment from three different plasmids.
Interpreting the Results of the Gel Electrophoresis
To interpret the results of the gel electrophoresis you must calculate the number and size of fragments for each sample that was run. Look at the image (photo or sketch) of the gel you ran in the last laboratory. The number of fragments for each of the samples is simply the number of bands in the different lanes. To determine the size of the fragments you need to know the size of the DNA marker fragments that were used. The size markers used in this exercise were bacteriophage λ DNA, which had been cut with the restriction enzyme HindIII. Use the physical map below (Figure 12-8), find the sites labeled HindIII, and determine the sizes of the fragments that would result if the DNA were cut at these sites. Note that unlike plasmid DNA, the bacteriophage λ DNA is linear. The figure shows it separated into two pieces for the convenience of depiction only.
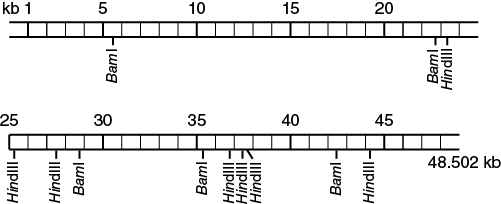
List the number and approximate size of each of the fragments in your laboratory notebook.
Use this list to match up with the fragment sizes in the marker lane of your gel image. Note that there are two very small fragments (<1000 bp) which may not be visible on your gel.
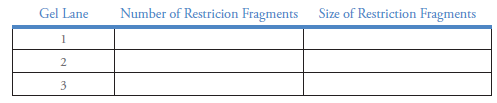
Now, using these marker fragments as a reference, determine the size of the fragments for each sample in each lane of the gel. Copy and complete Table 12-2 in your laboratory notebook.
Table 12-2. Number and size of the EcoRI restriction fragment from three samples analyzed by agarose gel electrophoresis.
Using this information you should now be able to compare Tables 12-1 and 12-2 to determine the identity of the plasmids run in the different lanes of the agarose gel.
Determining the Phenotypes of the Bacteria
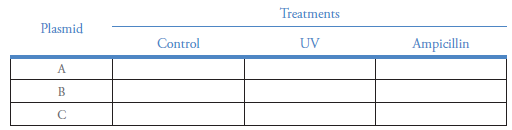
Examine the Petri dishes you plated in the last laboratory. The plasmids, which were used to transform these bacteria, contained genes that conferred additional phenotypic traits on the bacteria. To determine the phenotype conferred by each plasmid you must examine the relative growth under each of the treatments. The three treatments used were control, ampicillin, and ultraviolet light treatment. Ampicillin is an antibiotic that can prevent the growth of many bacteria. One of the plasmids used to transform the E. coli contains the gene for ampicillin resistance. Ultraviolet light can damage DNA. The E. coli strain that was used for these experiments is sensitive to UV damage of the DNA because a key DNA repair enzyme is missing from the strain. One of the plasmids used to transform the E. coli contains the gene for the DNA repair enzyme.
Procedure
- Count the number of bacterial colonies present on each of your Petri dishes. In your laboratory notebook make a table like the one below and record the number of colonies in your table.
Table 12-3. Number of bacterial colonies for each treatment.
Record your data on the chart on the chalkboard. When all of the data has been tabulated, enter it into an Excel spreadsheet. Calculate a mean and a standard deviation for each of the plasmids at each treatment. Create a graph and add the standard deviation. Make sure to label each axis and add a caption.
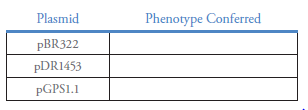
Re-examine the plasmid maps shown earlier and using your colony counts and the information about the plasmid, you should now be able to determine the identity of the plasmids used to transform the E. coli based on the phenotype conferred.
In your laboratory notebook record your conclusions using a table like the one shown below.
Table 12-4. Correlation between plasmid type and phenotype conferred.
Post-Lab Quiz
Proceed to the Post-Lab Quiz