Chapter 2. Carbon Metabolism: Rates of Photosynthesis and Cellular Respiration
General Purpose
This laboratory deals with the general concepts related to the measurement of the rate of cellular respiration indirectly by measuring the pH change generate by net CO2 produced.
Learning Objectives
General Purpose
Conceptual
- Understand the meaning of net cellular respiration
- Understand the relationship between CO2 level and solution pH
Procedural
- Understand the use of the spectrometer to quantitatively measure the pH of the solutions
Exercise 2. Cellular Respiration Rates with Different Sugar Sources (Work in Groups of 2)
Before you begin your experiments write a null and alternative hypothesis about the effects of different light intensities on the rate of photosynthesis as measured by carbon dioxide production in your laboratory notebook.
Write what you predict will happen in this experiment.
Make a note of what the independent variable and the dependent variable are in this experiment.
MATERIALS
8—50-mL flasks labelled blank, negative control, three glucose replicates and three replicates for another carbon source (sucrose, lactose, or lactose + lactase).
4 cuvettes
Yeast solution
Phenol red solution
PROCEDURE
Part I: Preparing the Cuvettes and Flasks
1. Label 8 clean 50-mL flasks as follows: one as blank, three as glucose replicates, three and another carbon source replicates (check with your instructor to confirm which carbon source your group is using) and one as negative control.
2. Using the labelled pipettes, add 10 mL of the appropriate sugar solution to each of the glucose and other carbon source flasks.
3. Add 10 mL of dH2O to the negative control flask and 15 mL of dH2O to the blank flask
4. Into the blank flask, pipette 5 mL of yeast solution.
5. Into the three replicate flasks and the negative control flask pipette 5 mL of phenol red solution.
6. Use the dropper bottle to add two drops of 0.1 M NaOH to each flask. The phenol red in contact with the NaOH should turn bright pink. CAUTION: Sodium hydroxide is a strong base; gloves and goggles must be worn.
Part II: Calibrating the Spectrometer
7. Obtain seven cuvettes—one for each treatment and one for a blank and one for a negative control. Rinse the cuvettes if they are not clean.
8. Prepare a blank by transferring 5 mL of yeast solution from the blank flask to a clean cuvette swirl the solution in the flask to resuspend the yeast before making the transfer.
9. Turn on the spectrometer by holding the power button on the right side for about three seconds or until the LED lights start to flash (see Figure 8-12).
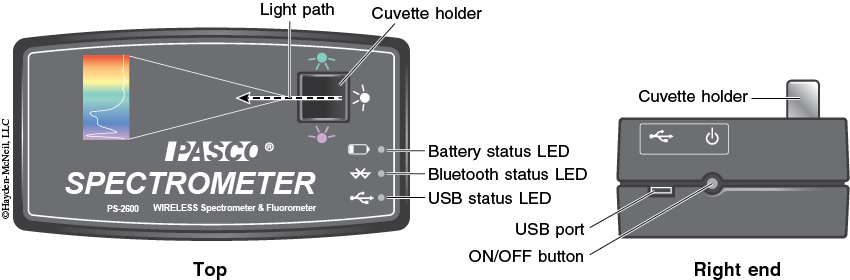
10. Plug the spectrometer into the computer via the USB cable (see Figure 8-12). To wirelessly connect to the spectrometer with a personal laptop or tablet, add a device in the Bluetooth settings and select the spectrometer that matches with the ID # on the bottom of the instrument.
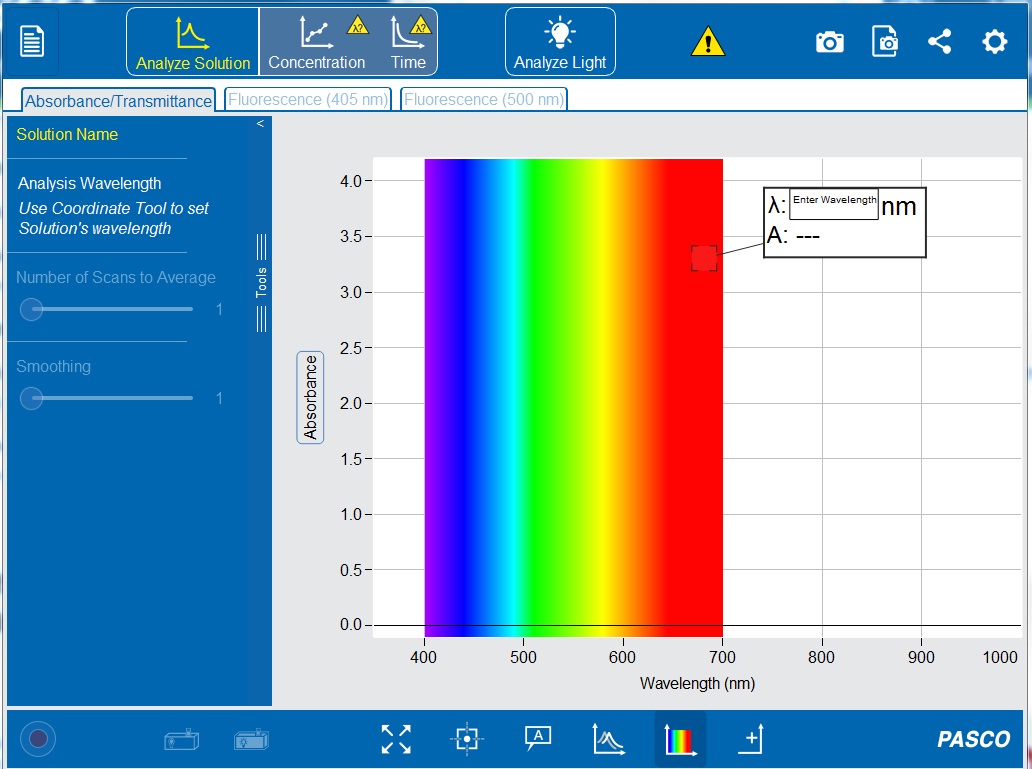
11. Open the PASCO Spectrometry app by click the icon ![]() . This should now show the initial screen of the PASCO Spectrometry display (see Figure 8-13) on your computer or tablet.
. This should now show the initial screen of the PASCO Spectrometry display (see Figure 8-13) on your computer or tablet.
12. After a few seconds, the ‘Connection Status’ symbols on the top toolbar should turn from ![]() to
to ![]() . Click the circle to check that the ID # on the bottom of the spectrometer matches the display on your computer or tablet. If connecting wirelessly, a ‘Sensor Not Found’ error should pop up. Click
. Click the circle to check that the ID # on the bottom of the spectrometer matches the display on your computer or tablet. If connecting wirelessly, a ‘Sensor Not Found’ error should pop up. Click ![]() . Select the spectrometer with the corresponding ID # and click
. Select the spectrometer with the corresponding ID # and click ![]() . If a connection error does not pop up, click
. If a connection error does not pop up, click ![]() on the top toolbar.
on the top toolbar.
13. Make sure the “Absorbance/Transmittance” tab ![]() is open on the top toolbar and the “Analyze Solution”
is open on the top toolbar and the “Analyze Solution” ![]() setting is selected.
setting is selected.
14. Wipe the blank cuvette with a Kimwipe and gently insert it into the cuvette holder. The cuvette should fit snugly. Do not remove the parafilm from the top of the cuvettes!
15. On the bottom toolbar, click “Calibrate Dark” ![]() to calibrate the spectrometer with the light turned off. A progress bar should appear, and after the calibration is complete, a check mark
to calibrate the spectrometer with the light turned off. A progress bar should appear, and after the calibration is complete, a check mark ![]() should appear.
should appear.
16. Wait one to two minutes to allow the light source to warm up, then click “Calibrate Reference” ![]() to calibrate the spectrometer to the blank solution with the light on.
to calibrate the spectrometer to the blank solution with the light on.
17. On the bottom toolbar, click “Start Record” ![]() . The symbol will change to the “Stop Record”
. The symbol will change to the “Stop Record” ![]() icon and a horizontal line should appear at 0.0 ODU, indicating the spectrometer was properly calibrated. Tiny peaks in the line show noise, but if there are major peaks, repeat steps 15 and 16 to recalibrate the spectrometer.
icon and a horizontal line should appear at 0.0 ODU, indicating the spectrometer was properly calibrated. Tiny peaks in the line show noise, but if there are major peaks, repeat steps 15 and 16 to recalibrate the spectrometer.
18. In the “Enter Wavelength” box on the display (see Figure 8-13) type 560 nm to set the wavelength to 560 nanometers. If the white Enter Wavelength box is not already displayed on the graph, click the ![]() “Add Coordinate Tool” on the bottom toolbar. The coordinate tool can also be manually moved to set a wavelength.
“Add Coordinate Tool” on the bottom toolbar. The coordinate tool can also be manually moved to set a wavelength.
19. Click ![]() to set the wavelength. A vertical line should appear on the graph at 560 nm, and the white box should now display the wavelength (λ) and the absorbance value (A).
to set the wavelength. A vertical line should appear on the graph at 560 nm, and the white box should now display the wavelength (λ) and the absorbance value (A).
20. Remove the blank cuvette from the spectrometer and return it to the rack.
Part III: Manually Measuring Absorbance Over Time: Read all steps before continuing; these steps are time sensitive!
Cellular respiration may occur much quicker than photosynthesis; do not continue until you are ready to measure.
21. Using the labelled pipette, add 5 mL of yeast solution to each of the negative control flask. Swirl the flask and quickly transfer ~5mL to the negative control cuvette.
22. Quickly wipe the cuvette with a Kimwipe, insert it in the cuvette holder. Record absorbance for zero minutes and the initial solution color in Table 8-2.
23. Carefully pour the phenol red solution from the cuvette back into the proper flasks and gently swirl.
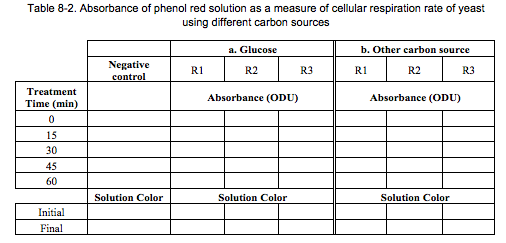
24. Set a timer for 15 minutes.
25. Repeat step 21-23 for each of the replicates (glucose and other carbon source). Make note of the order that the absorbance of each solution was measured.
26. After 15 minutes, transfer ~5 mL of each solution to separated cuvettes.
27. For each treatment, wipe the cuvette with a Kimwipe, place it in the cuvette holder, and record absorbance in Table 8-2. Use the same order as your initial readings.
28. Return the solutions to the appropriate flasks and gently swirl.
29. Set a timer for 15 minutes.
30. Repeat steps 26-29 total of 60 minutes.
31. Record the final solution color in Table 8-2.
CLEAN-UP PROCEDURE
1. Turn off the spectrometer by holding the power button.
2. Close the PASCO Spectrometry app. Leave the lab computer on.
3. Discard the yeast and phenol red solution in the sink.
4. Rinse all flasks and cuvettes until no phenol red remains. Return them to the racks upside-down to drain.
5. Return the labelled pipettes to the jars.
6. Discard only gloves in the biohazard bag.
7. Return the protocol sheets to the front table.
8. Push in your chair. See your instructor regarding any In-Class Assignment.
Post-Lab Quiz
Proceed to the Post-Lab Quiz