Chapter 2. EVOLUTION III—OVERVIEW
Learning Objectives
General Purpose
Conceptual
- Gain an understanding of how and why replica plating can be used to test a population against different selective pressures.
- Define the term gene pool and explain how it relates to the concept of evolution.
- Gain an understanding of the concept of genetic equilibrium and the conditions required for it to occur.
- Gain an understanding of the relationship between genetic equilibrium and evolution.
- Gain an understanding of the impact of selection.
Exercise 1. Examination of Replica Plating
PROCEDURE
- Examine the replica plates that you made during the last laboratory.
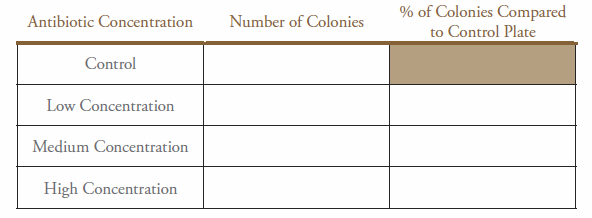
- Count the number and locations of the colonies on the treatment plates to the control plate. Only count colonies on the treatment plates that match locations on the control plate.
- Make a table in your laboratory notebook using Table 3-2 as a template.
Table 3-2. Number and percentage of surviving bacterial colonies.
Answer the following questions in your laboratory notebook:
What happened to the number of colonies as the antibiotic concentration in the growth media increased? How do you account for any differences?
How does the data compare to the original prediction?
Exercise 2. Using Population Models to Examine Warfarin Resistance in R. norvegicus
Use the PopG computer program to model the following scenarios for the impact on the allele frequency in a population.
Simulation Instruction
- Double-click on the PopG icon on the desktop.
- Once the program opens, go to the “Run” menu and pull down to “New Run.”
- Type in the settings for this simulation from the cases in the lab manual.
- Make sure that the “number of simultaneously evolving populations” is set to “1.”
- Click OK.
- To rerun the simulation using the same settings, go to the “Run” menu and pull down to “Restart.”
- To run a simulation using different settings, go to the “Run” menu and pull down to “New Run.”
Case 1
One study found that Baltimore had an estimated population of 48,000 R. norvegicus. If the rat population is reduced in Baltimore by 99%, what are the chances that a gene in the rat population will be fixed after 100 generations? In your laboratory notebook, report as a percentage the number of times an allele is fixed. (Run simulation at least 10 times.)
Case 2
Rat population can exhibit seasonal variation (see Figure 3-6).
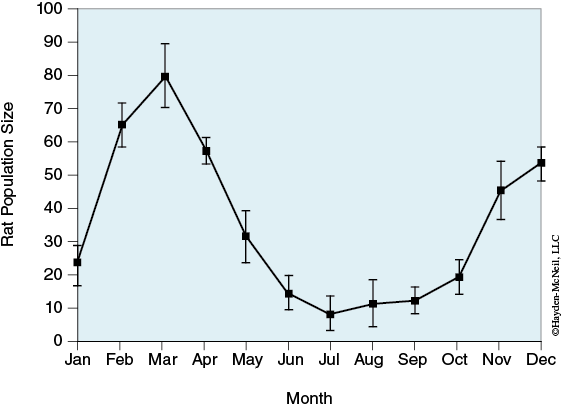
If the population in case 1 is further reduced to a seasonal low, what are the chances that a gene in the rat population will be fixed after 100 generations? In your laboratory notebook, report as a percentage the number of times an allele is fixed. (Run simulation at least 10 times.)
Case 3
Migration between populations can prevent loss of alleles. In order to successfully prevent an allele loss, the percentage of migrating individuals required to move into a population and successfully mate is very small. Calculate the minimum migration rate required to prevent gene fixation in a population size found in case 2. (You must use two populations in PopG for this analysis.) In your laboratory notebook, report the minimum migration rate required to prevent gene fixation.
Case 4
One way to control rat populations is by putting out poisoned bait. Warfarin was seen as a promising poison because death due to warfarin occurs days after ingestion, so rats would not link its effects with the poisoned bait. Death due to warfarin results from an inhibition of vitamin K reductase, an enzyme required for blood coagulation. Mutations in the vitamin K reductase gene can confer warfarin resistance. When this mutation is present in a rat population and warfarin is extensively used for rat poison, selection will favor the warfarin-resistant phenotype. If the allele conferring warfarin resistance is dominant, what is the average number of generations it will take for this allele to fix if 80% of the susceptible rats are killed? In your laboratory notebook, report the average number of generations it will take for this allele to fix. (Set population size to 10,000 and run simulation at least 10 times.)
Case 5
If the conditions are similar to case 4, but instead the allele conferring warfarin resistance is recessive, what is the average number of generations it will take for this allele to fix if 80% of the susceptible rats are killed? In your laboratory notebook, report the average number of generations it will take for this allele to fix. (Set population size to 10,000 and run simulation at least 10 times.)
Answer the following question in your laboratory notebook:
Why are these two cases (4 and 5) different?
Case 6
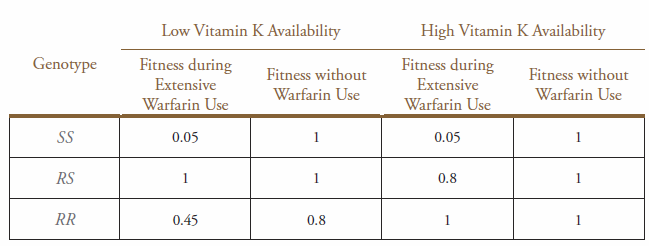
Vitamin K reductase requires vitamin K to function. Different alleles at this locus vary in their vitamin requirements. One allele (designated R, resistant to warfarin) confers warfarin resistance, but also results in a twentyfold increase in vitamin K requirement compared to the other allele (designated S, susceptible to warfarin) for its primary physiological function (Pelz, 2007). In areas where vitamin K is readily available, the two allele types are equally fit. In areas where rats do not have sufficient vitamin K, homozygous RR individuals are less fit (see Table 3-3). However, since the R allele confers resistance to warfarin, rats expressing this allele are favored in areas where warfarin is used, despite its disadvantage in vitamin K utilization.
Table 3-3. Fitness of genotypes of R. norvegicus population with vitamin K reductase mutation requiring additional vitamin K for proper functioning in the presence or absence of warfarin. Fitness in low vitamin K availability estimated from Pelz (2007).
Answer the following question in your laboratory notebook:
In which environment (high versus limited vitamin K availability, warfarin present or not) is there a heterozygote advantage?
Using the appropriate fitness values, the PopG model, and the Hardy-Weinberg equation,
what fraction of the population is heterozygous in the heterozygous-advantage population after 100 generations? In your laboratory notebook, report the average fraction of the population that is heterozygous in the heterozygous-advantage population after 100 generations. (Set population size to 10,000 and run simulation at least 10 times.)
Post-Lab Quiz
Proceed to the Post-Lab Quiz