Chapter 2. Population Ecology
Learning Objectives
Post-Lab
false
false
Convert each of your absorbance readings to a population density (number of Chlamydomonas/mL) using either the standard curve shown below (see Figure 4-12), or the equation that relates absorbance at 750 nm to the Chlamydomonas population size.
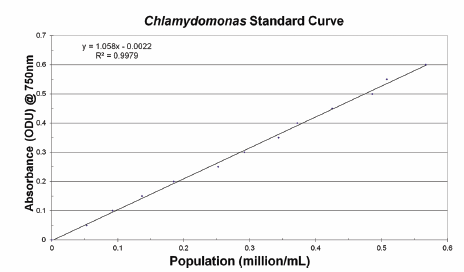
Figure 4-12. Standard curve relating absorbance at 750 nm to cell number per mL.
This standard curve shows a linear relationship between population density and absorbance at 750 nm. The equation for the best-fit line for this data is Absorbance = 1.058 (millions of cells/mL) − 0.0022 and the correlation coefficient (R2) is 0.9979.
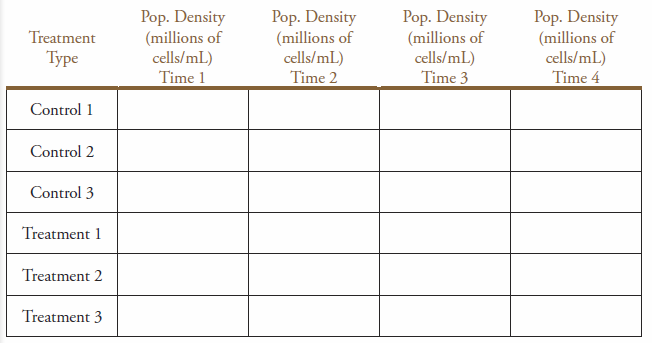
Make a table in your laboratory notebook similar to the example shown in Table 4-6 to record your population density data of your C. reinhardtii cultures.
Table 4-6. Population density of Chlamydomonas cultures.