C2-b: Drafting the body
The body of your essay develops support for your thesis, so it’s important to have at least a working thesis before you start writing. What does your thesis promise readers? What question are you trying to answer? What problem are you trying to solve? What is your position on the topic? Keep these questions in mind as you draft the body of your essay.
Asking questions as you draft
You may already have written an introduction that includes your working thesis. If not, as long as you have a draft thesis, you can begin developing the body and return later to the introduction. If your working thesis suggests a plan or if you have sketched a preliminary outline, try to organize your paragraphs accordingly.
Draft the body of your essay by writing at least one paragraph about each supporting point you listed in the planning stage. As you draft the body, keep asking questions; keep anticipating what your readers may need to know.
For more detailed help with drafting and developing paragraphs, see C5.
using sources responsibly: As you draft, keep careful notes about sources you read and consult. (See R2-c.) If you quote, paraphrase, or summarize a source, include a citation, even in your draft. You will save time and avoid plagiarism if you follow the rules of citation while drafting.
Adding visuals as you draft
As you draft, you may decide that support for your thesis could come from one or more visuals. Visuals can convey information concisely and powerfully. Graphs and tables, for example, can simplify complex numerical information. Images—including photographs and diagrams—often express an idea more vividly than words can. Keep in mind that if you download a visual or use published information to create your own visual, you must credit your source.
Always consider how a visual supports your purpose and how your audience might respond to it. A student writing about the shift from print to online news, for example, used a screen shot of a link embedded in a news article to illustrate a point (see A4-h). Another student, writing about treatments for childhood obesity, created a table to display data she discussed in her paper (see APA-5b).
As you draft, carefully choose visuals to supplement your writing, not to substitute for it. The chart below describes eight types of visuals and their purposes.
Choosing visuals to suit your purpose
Pie chart
| Pie charts compare a part or parts to the whole. Segments of the pie represent percentages of the whole (and always total 100 percent). |

Kaiser Foundation
|
Bar graph (or line graph)
| Bar graphs highlight trends over a period of time or compare numerical data. Line graphs display the same data as bar graphs; the data are graphed as points, and the points are connected with lines. |
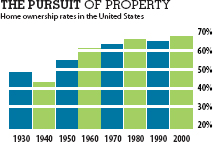
US Census Bureau
|
Infographic
| An infographic presents data in a visually engaging form. The data are usually numerical, as in bar graphs or line graphs, but they are represented by a graphic element instead of by bars or lines. |
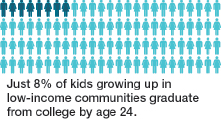
Data provided courtesy of www.postsecondary.org
|
Table
| Tables display numbers and words in columns and rows. They can be used to organize complicated numerical information into an easily understood format. |
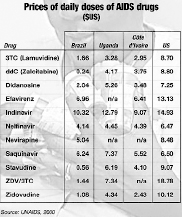
UNAIDS
|
Photograph
| Photographs vividly depict people, scenes, or objects discussed in a text. |

“Tornado Touch,” photo by Fred Zwicky © 2004. Reprinted by permission of the author. Courtesy of NIAMS Image Gallery
|
Diagram
| Diagrams, useful in scientific and technical writing, concisely illustrate processes, structures, or interactions. |
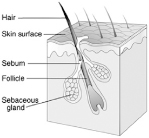
Arizona Board of Regents
|
Flowchart
| Flowcharts show structures (the hierarchy of employees at a company, for example) or steps in a process and their relation to one another. (See also S3-e for another example.) |
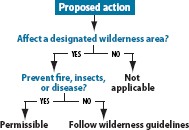
Lynn Hunt et al., The Making of the West. Copyright © 2005 by Bedford/St. Martin’s. Reprinted by permission of Bedford/St. Martin’s.
|
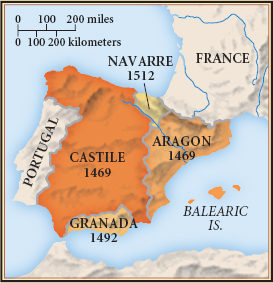
Map
| Maps illustrate distances, historical information, or demographics and often use symbols for geographic features and points of interest. |
|