Sample bar graph 1
Bar graph with horizontal and vertical scales
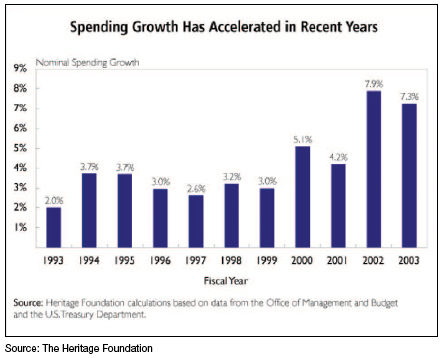
This two axes of a bar graph show the relationship between two types of data. In this case, the vertical scale, or y-axis, represents growth rate as a percentage; the horizontal scale, or x-axis, represents time in fiscal years.
Go to related page: Types of visuals to suit your purpose